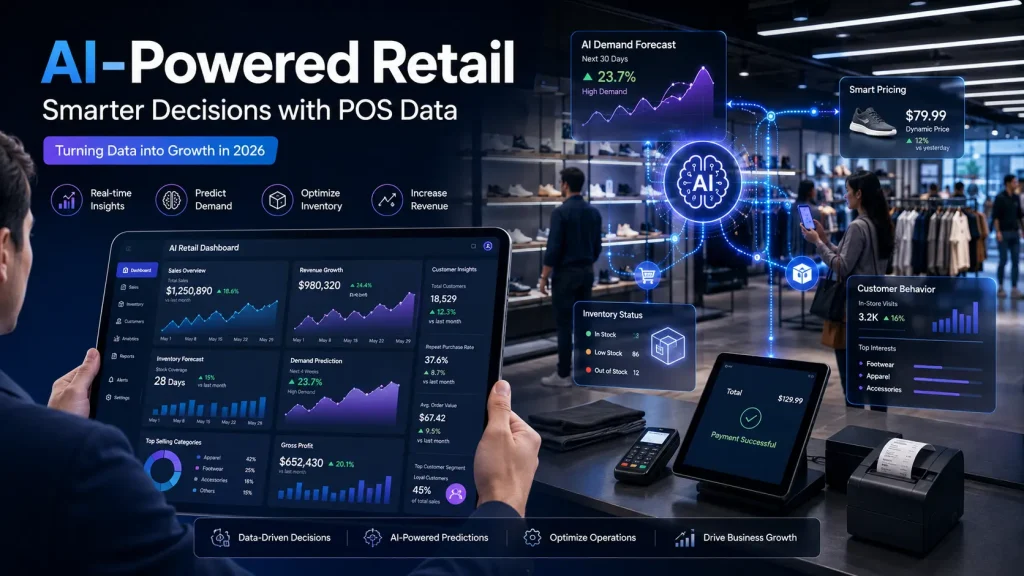
AI-powered retail is transforming how businesses turn POS data into smarter decisions, yet most retailers are still drowning in data and starving for insight.
Every day, your POS system records thousands of transactions — which products sold, when, at what price, alongside what, to whom, and how often items were returned. Inventory management software tracks every stock movement across locations. Loyalty programs capture redemption activity and customer engagement patterns. Meanwhile, ecommerce platforms record every click, cart addition, and conversion, creating a rich stream of behavioral data.
And yet, the majority of retail businesses review a weekly sales report, make gut-feel reorder decisions, and wonder why certain promotions don’t move the needle.
The gap between the data you’re collecting and the decisions that data could drive is where AI-powered retail lives — and in 2026, it’s the gap separating the retailers growing at double digits from those losing ground to competitors who are.
Here is the honest, direct answer to what AI-powered retail actually is:
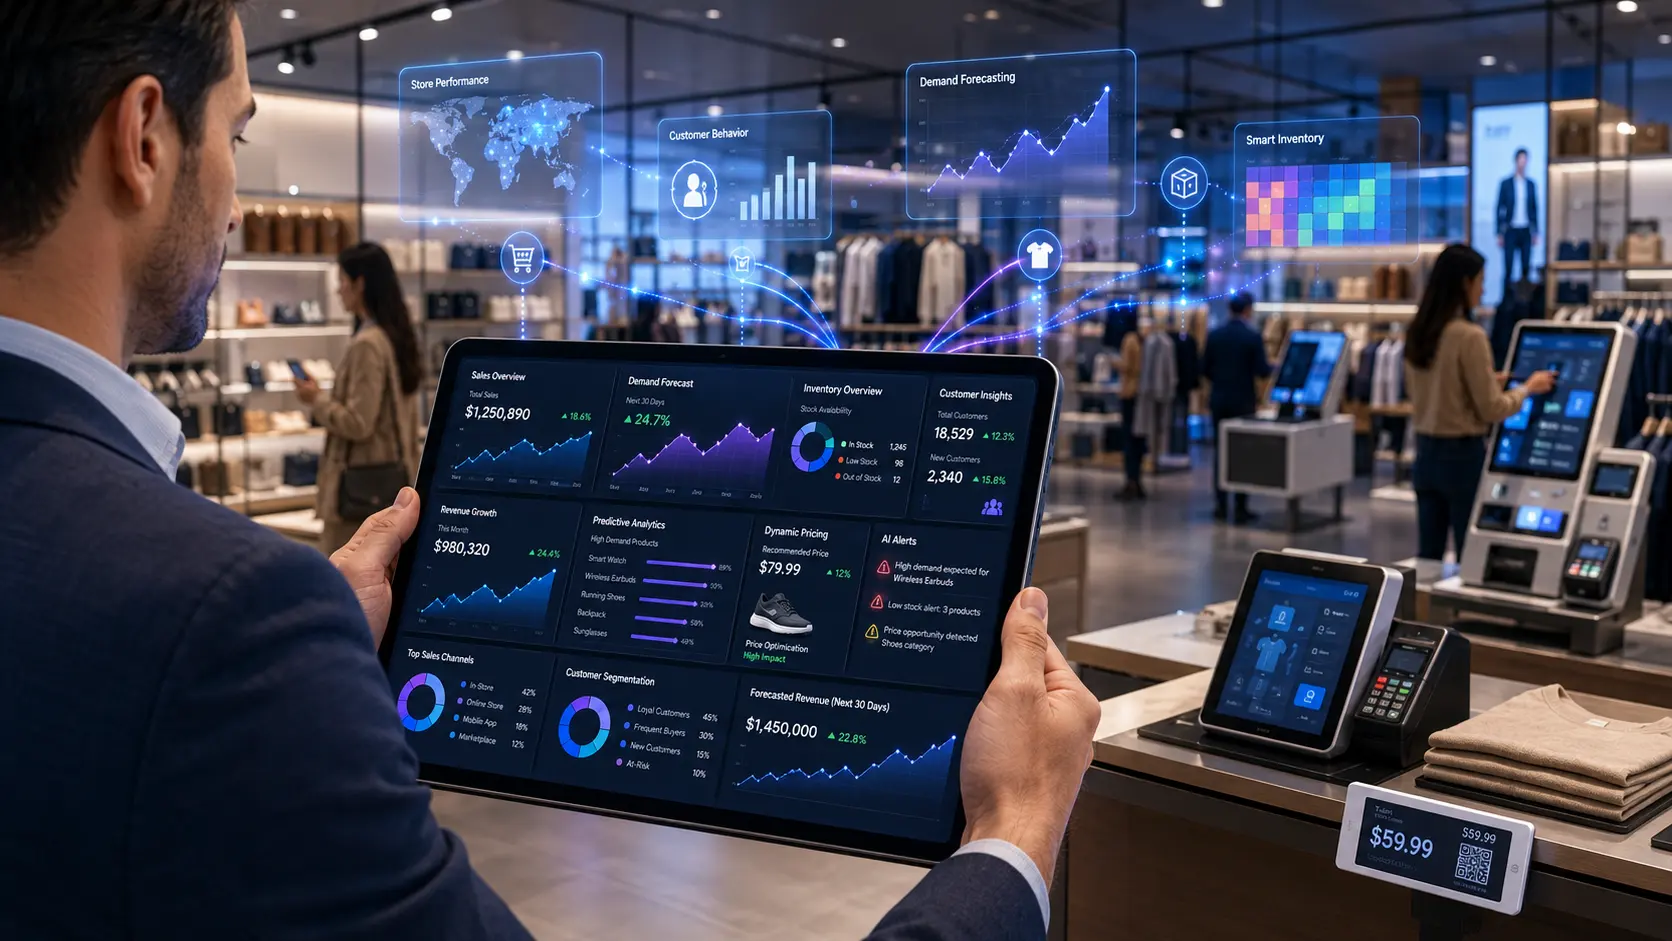
AI-powered retail uses artificial intelligence and machine learning to transform raw POS transaction data — every sale, return, product interaction, and customer touchpoint — into actionable business intelligence. Instead of reviewing last month’s sales report, retailers using AI analytics get real-time demand forecasts, automatic inventory replenishment triggers, personalized customer promotions, and dynamic pricing recommendations delivered directly into operational systems — without requiring a data science team to interpret them.
The numbers behind this shift are unambiguous. The global AI in retail market reached $18.4 billion in 2026, with projections showing $130.88 billion by 2033, according to Coherent Market Insights. According to NVIDIA’s 2026 Retail and CPG Survey (via CompaniesHistory), 89% of retailers are now actively using or testing AI, and 58% have moved to full active deployment — up 16 percentage points from the prior year. Retailers leveraging AI have recorded 5–15% annual revenue growth, with 69% reporting measurable gains, per AllAboutAI’s analysis of Gartner data.
This guide gives you everything you need to move from data-rich and insight-poor to data-driven and competitively positioned.
What this guide covers:
- What separates AI-powered retail from traditional analytics — and why the difference matters
- The four data layers your POS collects that fuel every AI capability
- How the AI data pipeline transforms raw transactions into automated decisions
- Eight specific AI use cases with real ROI data and real business examples
- The retail KPIs you should actually be tracking
- A data readiness checklist — the prerequisite step 80% of businesses skip
- Vertical-specific guidance for small retailers, restaurants, multi-location chains, and enterprises
- Off-the-shelf AI analytics vs. custom AI development — which path fits your stage
- A practical five-phase implementation roadmap
- Where AI in retail is heading next
What Is AI-Powered Retail? (And What Makes It Different from Regular Analytics)
Before diving into use cases and ROI numbers, it’s worth being precise about what AI-powered retail actually means — because most articles conflate it with having a reporting dashboard, which is something entirely different.
Traditional retail analytics is descriptive: it tells you what already happened. Last week’s bestsellers. Yesterday’s inventory count. Last quarter’s margin by category. This is valuable, but it requires a human to read the report, draw conclusions, and decide what to do next. And by the time the report is generated, the moment to act has often already passed.
AI-powered retail analytics is predictive and prescriptive: it tells you what will happen next and recommends — or automatically executes — the optimal action before the event occurs. Rather than waiting for you to notice that SKU #4421 is trending toward a stockout, the system can trigger a reorder days before shelves go empty. Instead of relying on managers to review this month’s promotional performance, AI analyzes campaign results in real time. The platform then identifies the customer segments most likely to respond to a specific offer and deploys it automatically.
Traditional Analytics vs. AI-Powered Retail Analytics
| Dimension | Traditional POS Analytics | AI-Powered Retail Analytics |
|---|---|---|
| Data processing | Batch (daily or weekly reports) | Real-time continuous |
| Insight type | Descriptive (“what happened”) | Predictive + prescriptive (“what will happen + what to do”) |
| Inventory management | Reactive (reorder when stock runs out) | Proactive (auto-reorder before stockout) |
| Customer targeting | Broad segment-level campaigns | Individual-level personalization at scale |
| Pricing decisions | Manual review and periodic adjustment | Dynamic, automated optimization |
| Pattern detection | Human-reviewed reports | ML models detecting non-obvious multi-variable signals |
| Speed to insight | Hours to days | Seconds to minutes |
| Learning capability | Static rules and reports | Self-improving models that get more accurate over time |
| Staff requirement | Analyst or manager reviews reports | Exception-based: staff address what AI flags |
Why 2026 Is the Inflection Point
Three forces converged to make 2026 the year retail AI moved from optional to operational.
First, cloud POS infrastructure became the norm, giving AI models real-time access to transaction streams rather than nightly batch files. Second, ML model cost dropped dramatically — the compute required to run demand forecasting models that once cost $500,000/year now runs for under $2,000/month on cloud infrastructure. Third, off-the-shelf AI analytics platforms matured enough that businesses without dedicated data science teams can deploy meaningful capabilities.
Adoption of AI-driven POS analytics increased 29% in 2025 alone (Retailcloud), and 91% of retail executives now believe AI will fundamentally transform how retail businesses operate, according to CTO Magazine via VusionGroup.
Machine learning currently holds 50.2% of the AI retail technology market — the dominant segment. The infrastructure investment is here. The question is whether your business is using it.
For context on how your POS infrastructure affects your AI capabilities, see our guide: Cloud POS vs On-Premise POS: Which Is Right for Your Business?
Your POS System Is Sitting on a Gold Mine — Here’s What Data It Actually Collects
This is the section most AI retail articles skip — and it’s the one that makes everything else make sense. Before understanding what AI does with your POS data, you need to understand exactly what your POS is capturing with every transaction.
A mid-size 3-location retailer processing 500 transactions per day generates approximately 180,000 transaction records per year. Each record contains 30–50 data fields. That’s 5–9 million data points annually — far more than any human team can reliably analyze, and exactly the scale at which machine learning models begin delivering genuine advantages over intuition.
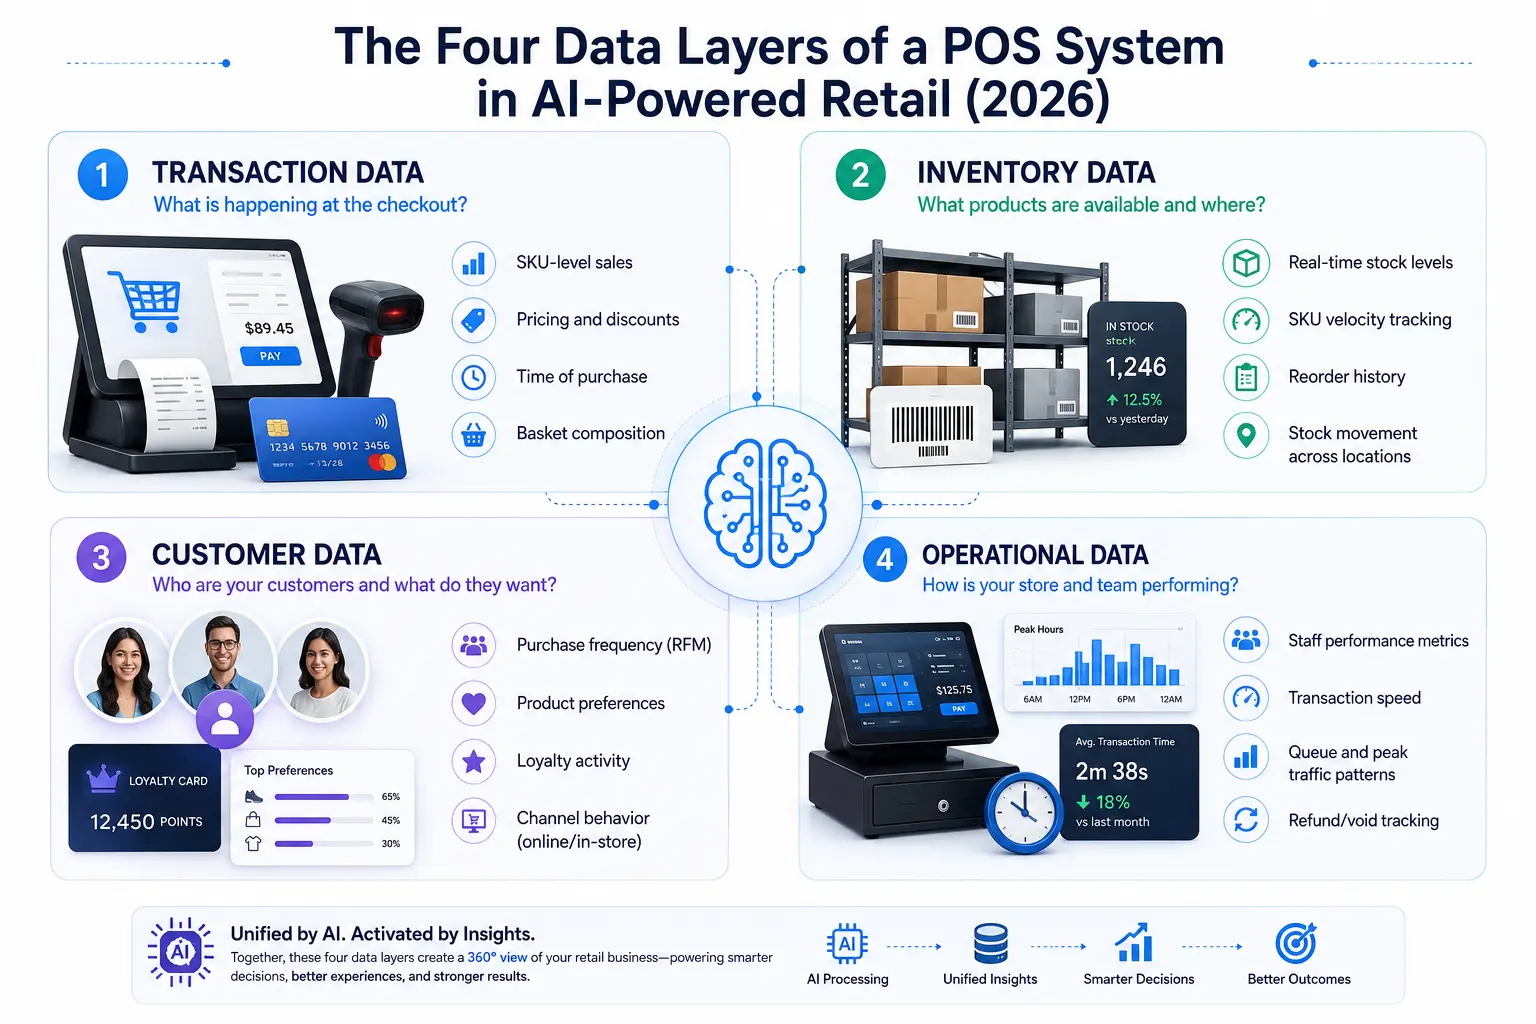
The Four Data Layers Every POS System Captures
Layer 1: Transaction Data (The Core)
Every sale encodes a remarkable amount of signal:
- SKU-level detail: what sold, in what quantity, at what listed price, with what discount applied, at what time of day
- Payment method: cash, card type (debit vs. credit, card network), mobile wallet, gift card, loyalty redemption, or split payment
- Returns and exchanges: the product, the return reason code, the time gap between purchase and return, the staff member processing it
- Basket composition: which products appear together in the same transaction — the raw input for market basket analysis
- Temporal patterns: day of week, time of day, week of month, seasonal position — all embedded in every transaction timestamp
Layer 2: Inventory Data (The Supply Signal)
- Real-time stock levels by SKU, variant (size, color, style), and physical location
- Stock velocity: how fast each item is moving under current conditions vs. historical averages
- Shrinkage signals: discrepancies between inventory count and transaction count that may indicate theft, damage, or recording error
- Reorder history and supplier lead time data: how long restocking actually takes under different conditions
Layer 3: Customer Data (The Relationship Layer)
For any business with a loyalty program or customer accounts, POS captures:
- Purchase frequency, recency, and monetary value — the three inputs to RFM (Recency, Frequency, Monetary) scoring, the most widely used customer segmentation model in retail
- Product preferences and category affinity: does this customer always buy premium? Always buy sale items? Always buy in certain categories and never others?
- Promotion response history: which discount levels actually converted this customer, and which were ignored
- Channel behavior: does this customer primarily buy in-store, online, or via BOPIS? This shapes the right engagement approach
- Loyalty program interaction: earned vs. redeemed points, redemption triggers, tier progression
Layer 4: Operational Data (The Efficiency Signal)
- Transaction processing speed and queue length patterns — peak demand periods for staffing optimization
- Staff-level performance metrics: transactions per hour, upsell rate, void and discount authorization frequency
- Payment failure rates by method and terminal — quality control signals
- Void, refund, and discount override patterns by staff member, time of day, and location
Per RingCentral’s 2026 retail AI implementation guide, effective retail AI solutions require “POS history, product and location data from your ERP and WMS, plus customer profiles and behavior from your CRM or CDP” — and “clean, consistently structured data that integrates across your systems delivers stronger outcomes faster.” The data is already there. The question is whether it’s structured, unified, and accessible.
For businesses building POS systems specifically designed to capture and structure this data for AI readiness, Corexta’s custom POS development services design the data architecture before a line of code is written.
How AI Transforms POS Data Into Business Decisions — The Processing Pipeline
Understanding that AI uses your POS data is one thing. Understanding how it does so is what separates businesses that implement AI effectively from the 80% that invest in it without results.
Here is the five-stage pipeline that converts raw transaction records into automated business decisions.
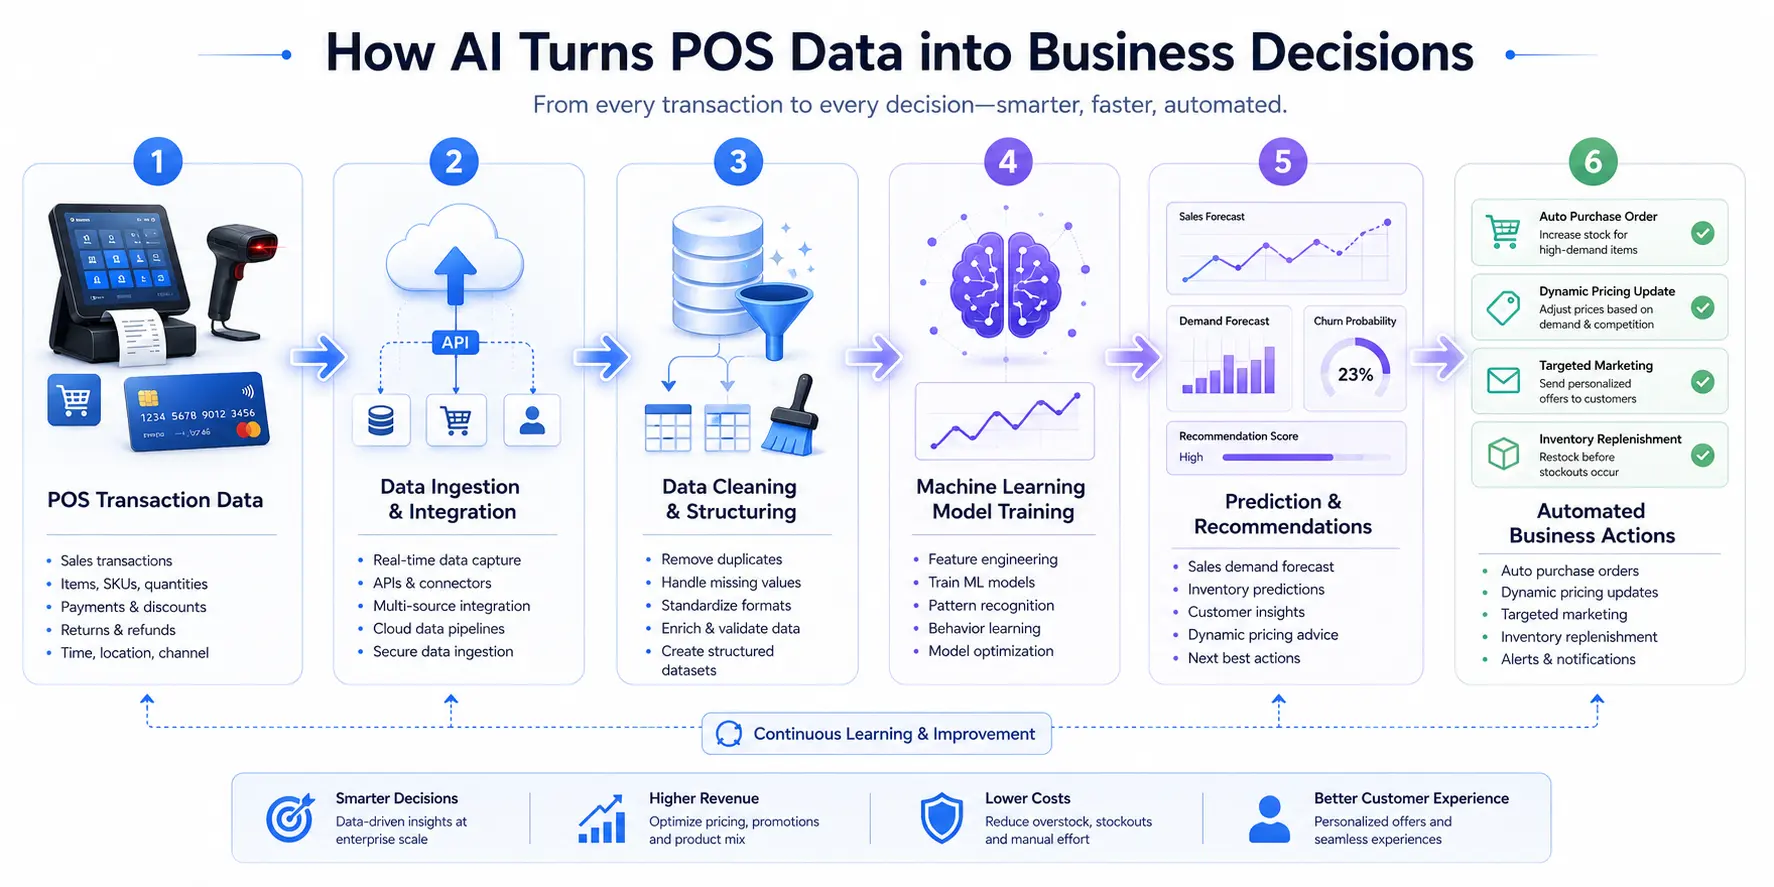
Stage 1 — Data Ingestion and Unification
Transaction streams from your POS connect to a central data platform — a cloud data warehouse (Snowflake, BigQuery, Redshift) or data lake — in real time. This is not a nightly export. It is a continuous API-based or webhook-driven stream that makes every transaction available for analysis within seconds of completion.
This is also where external data joins the stream. Weather forecasts for the next 14 days. Local events calendars. Competitor pricing feeds. Social trend signals. Supplier lead time data. Each external source adds predictive power that transaction data alone can’t provide.
Critically, data from your ecommerce platform, loyalty CRM, and inventory management system merges with your POS data into a unified dataset here. A customer’s online browsing behavior and in-store purchase history join the same record. This is why omnichannel POS and ecommerce integration is the prerequisite to advanced retail AI — the more complete the data picture, the more accurate the models.
Stage 2 — Data Cleaning and Feature Engineering
Machine learning models are only as good as the data they’re trained on. This stage is where data quality problems either get resolved or permanently limit your AI’s accuracy.
Raw POS data contains noise: duplicate records from system errors, missing values from connectivity interruptions, outlier transactions from erroneous entries, and inconsistent product identifiers across systems. All of this requires systematic cleaning before model training begins.
Feature engineering extracts the meaningful signals from raw fields: calculating a customer’s “days since last purchase,” computing a product’s “rolling 30-day sales velocity,” deriving “promotion-adjusted baseline sales” by stripping promotional lift from historical data. These engineered features, not raw transaction fields, become the inputs to machine learning models.
This is precisely why Harvard Business Review reports that 80% of AI projects fail to deliver expected value — with data quality issues affecting 77% of organizations attempting deployment. Skipping data preparation is the most expensive shortcut in retail technology.
Stage 3 — Model Training and Validation
ML models learn from historical data by identifying the patterns that predicted specific outcomes in the past. A demand forecasting model learns which combinations of factors (day of week, promotional calendar, weather, recent velocity) predicted sales volumes. A churn prediction model learns which behavioral signals preceded customers going silent.
Models are validated against held-out data — transactions intentionally withheld from training — to verify they generalize rather than simply memorizing historical patterns. Only validated models move to production.
The most important characteristic of modern retail ML models: they continuously retrain as new data flows in. A model trained in January becomes more accurate by March. By December, it has learned your business’s seasonal patterns, promotional elasticity, and customer behavior with a level of precision no human analyst can match.
Stage 4 — Prediction and Recommendation Generation
Trained models apply their learned patterns to current data. Today’s inventory levels, this week’s transaction velocity, this customer’s purchase history, current competitor pricing, tomorrow’s weather forecast — all of these inputs combine to produce specific, actionable predictions.
“Reorder SKU #4421 in 3 days — projected stockout based on current velocity and lead time.” “Customer segment D (high-value, declining frequency) responds to 20% discount triggers with 73% probability.” “Shift 40 units of Product A from location 3 to location 7 before the weekend — location 7’s sell-through rate is 3x higher.” These are not summaries for humans to review. They are instructions for automated systems to execute.
Stage 5 — Action and Automation
Model outputs connect to operational systems via API. Demand forecasts trigger automatic purchase orders to suppliers through your order management and fulfillment system. Dynamic pricing updates push to your ecommerce site and POS terminals simultaneously. Personalized promotion triggers fire to your email and SMS marketing platform. Staff receive exception alerts — “Location 2 is trending toward a 2-hour queue during the 5–7 PM window on Friday” — rather than having to review dashboards proactively.
The loop then closes: the outcomes of automated actions feed back into training data, improving the accuracy of future predictions in a continuous learning cycle.
Eight AI Use Cases That Directly Impact Retail Revenue and Margins
These are not theoretical. Every use case below includes verified ROI data and real-world examples from retailers who have already deployed them.
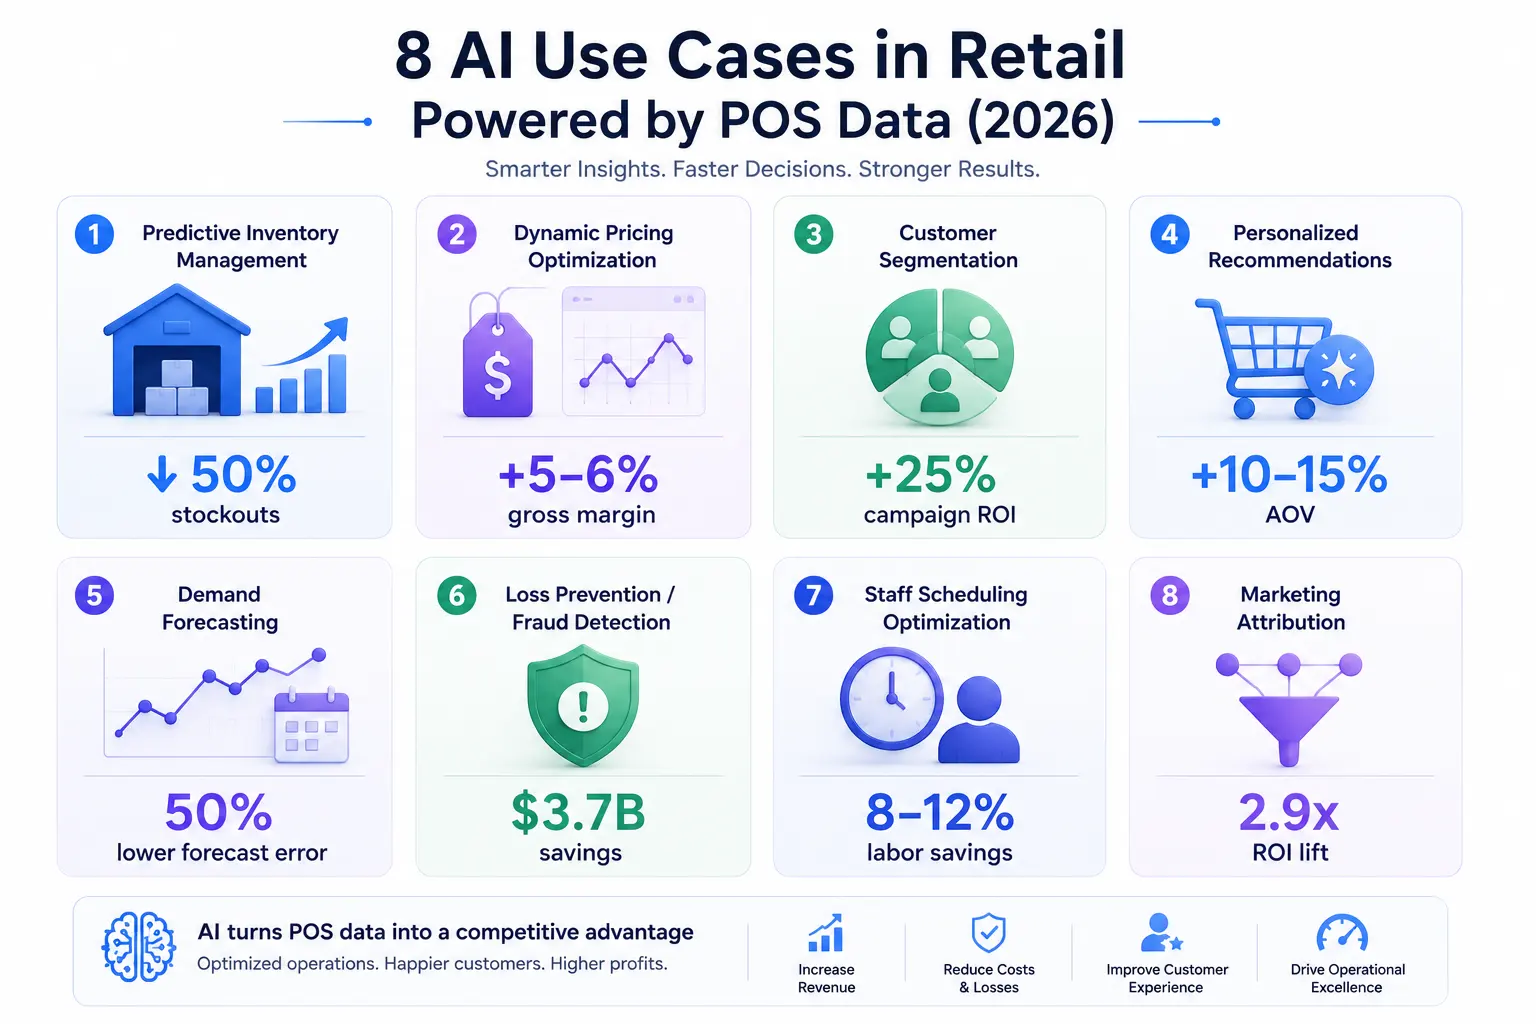
1. Predictive Inventory Management
What it does: Uses POS sales velocity, seasonal patterns, promotional calendars, external signals (weather, local events), and supplier lead time history to automatically forecast demand at the SKU and location level — triggering reorders before stockouts occur rather than after.
Verified outcomes:
- AI-driven inventory management reduces stockouts by 50% and overstocks by 25%, per Gitnux’s 2026 AI in Retail Statistics
- ML demand forecasting reduces forecasting errors by up to 50% and decreases inventory costs by 10% (Retailcloud)
- 20% average revenue increase from predictive analytics that prevents lost sales through stockout reduction (AllAboutAI citing NVIDIA data)
- A European grocery chain reported a 15% reduction in food waste after deploying ML models for predictive resource analysis (Intellias)
Real example: Zara uses AI-based forecasting to analyze POS transaction data, social listening signals, weather patterns, and trend analytics simultaneously — producing demand forecasts at the regional and store level that power the company’s just-in-time inventory model. The result: one of the fashion industry’s lowest markdown rates and highest inventory turnover ratios. (RBMSoft)
Connection to your infrastructure: This use case depends entirely on real-time inventory data. Custom inventory management software designed with AI readiness in mind makes SKU-level demand forecasting significantly more accurate.
2. Dynamic Pricing Optimization
What it does: Continuously analyzes competitor pricing feeds, current inventory levels, demand velocity, time-to-expiry (for perishables), and customer price sensitivity signals from purchase history to optimize prices at the product level — increasing margin capture without creating the customer alienation that manual markdowns can produce.
Verified outcomes:
- Dynamic pricing AI increases gross margins by 5.1% on average (Gitnux)
- AI-powered dynamic pricing delivers 3–6% gross margin improvement — equivalent to $1.8–$4.5 million in additional revenue for a mid-size retailer (Ringly.io citing Mindit)
- Dynamic pricing models increase average revenue per user by 5–10% (CareerTrainer AI)
- Automated markdown AI improved pricing recovery by 12% in tested deployments (Gitnux consumer retail statistics)
The hidden value: Most retailers lose significant margin at end-of-season through late, deep markdowns. AI dynamic pricing systems identify the optimal markdown timing and depth — clearing inventory at the highest possible average selling price rather than the panic discounts that slash margin in the final weeks of a season.
3. Customer Behavior Analytics and Segmentation
What it does: Builds individual-level customer profiles from POS transaction history, calculating RFM scores (Recency, Frequency, Monetary value), product category affinities, promotion response rates, channel preferences, and churn risk signals. Automatically segments customers into actionable groups that receive different treatment strategies.
Verified outcomes:
- AI customer segmentation improves campaign response rates by 28% (Gitnux)
- AI-powered predictive analytics for customer segmentation improves campaign ROI by 10–25% (CareerTrainer AI)
- Retailers using AI see 2.9x higher marketing ROI compared to non-AI users (Gitnux global retail statistics)
- McKinsey analysis: personalization leaders grow approximately 10 percentage points faster annually than competitors and generate 40% more revenue from their personalization efforts (Envive AI analysis)
Practical example: An RFM analysis of your customer base will typically reveal that the top 20% of customers by value generate 60–80% of revenue. AI identifies this group automatically, tracks their behavioral signals in real time, and triggers proactive retention interventions when their purchase frequency begins declining — before they lapse, not after.
Real example: Levi Strauss uses AI-driven segmentation models that assess behavioral, transactional, and demographic data to craft highly relevant campaigns — achieving higher engagement and marketing ROI while minimizing customer acquisition costs. (Acropolium)
4. Personalized Recommendations and Promotions
What it does: Uses market basket analysis and purchase affinity models trained on POS data to recommend complementary products at checkout, in post-purchase communications, and across ecommerce channels — surfacing the right product to the right customer at the moment they’re most likely to buy.
Verified outcomes:
- 71% of ecommerce sites use AI-driven product recommendations, generating 35% of total ecommerce revenue (AllAboutAI citing eComposer and AMRA & ELMA)
- AI upsell engines at checkout lift average order value by 10–15% (Gitnux)
- Personalized promotions via AI boost sales by 10–30% per McKinsey analysis (Gitnux global statistics)
- One sportswear brand using personalized omnichannel AI messaging across email, web push, and SMS achieved a 49x ROI and a 700% increase in customer acquisition (InsiderOne)
- The average payback period for AI-enabled personalization solutions is 9 months (Envive)
How it works in practice: A grocery retailer trains a market basket model on 12 months of POS transaction data and discovers that customers who purchase premium olive oil have an 84% probability of also purchasing fresh pasta in the same or following transaction when prompted. A trigger fires at checkout — “Complete your meal: fresh pasta in aisle 4” — with measurable conversion. The insight came entirely from the existing POS transaction record.
5. Demand Forecasting at the Location and SKU Level
What it does: Generates location-specific and SKU-level demand forecasts that blend POS sales velocity with promotional lift factors, local event calendars, weather forecasts, and broader macroeconomic and trend signals — giving purchasing teams accurate 30, 60, and 90-day demand projections before they place supplier orders.
Verified outcomes:
- Modern AI systems achieve 20–50% reduction in demand forecasting errors (Articsledge citing HBR and McKinsey)
- 20% average revenue increase from predictive analytics enabling better inventory planning (AllAboutAI)
- A demand forecasting model for a US retail client built by RBMSoft reduced stockouts and improved forecast accuracy by leveraging POS data across all channels to deliver data-backed inventory optimization (RBMSoft)
- Walmart’s AI demand system reduced stockouts by 30% while saving 30 million unnecessary transportation miles annually through optimized inventory placement and route planning (Articsledge citing McKinsey/HBR)
The external data multiplier: A spike in online search volume for “rain boots” in a specific region can signal an imminent demand surge — prompting stores to adjust orders before the rush hits. This type of external signal integration, combined with POS velocity data, is what makes AI demand forecasting dramatically more accurate than any spreadsheet model. (VusionGroup)
Where demand forecasting feeds directly into procurement and supplier management, order management and fulfillment software designed to receive AI forecast outputs automates the reorder process end-to-end.
6. Loss Prevention and Fraud Detection
What it does: Analyzes POS transaction patterns for behavioral anomalies — void clustering, refund frequency by staff member, transaction timing irregularities, discount authorization circumvention patterns, and inventory discrepancy signals — to detect both internal (employee) theft and external fraud in real time.
Verified outcomes:
- AI fraud detection saves the retail industry $3.7 billion annually in prevented losses (Gitnux global retail statistics)
- AI fraud detection at POS blocks 95% of fraudulent transactions (Gitnux consumer retail statistics)
- Automated returns fraud detection reduces fraudulent returns by 30–50% with minimal impact on legitimate customer experience (The Thinking Company)
- AI fraud detection systems provide ROI within 2–4 months of deployment — one of the fastest payback periods of any retail AI use case
Real example: Marks & Spencer employs AI-driven analytics to monitor POS data and detect irregularities indicative of employee or customer fraud — including specific void and refund behavioral patterns that manual supervision consistently misses. (Acropolium)
Why this matters beyond security: Internal shrinkage (employee theft) accounts for approximately 28% of total retail shrink. For a retailer with $10M in annual revenue and a 1.5% shrink rate, that’s $42,000/year in internal theft. AI POS monitoring identifies and closes this leak systematically.
7. Staff Scheduling Optimization
What it does: Correlates POS transaction volume patterns, customer foot traffic data, queue length signals, and seasonal factors to forecast staffing requirements by location, day, and hour — enabling labor schedules that match predicted demand rather than fixed historical rosters.
Verified outcomes:
- Dynamic scheduling systems tie traffic data to labor costs, reducing unnecessary staffing while increasing conversion rates during peak periods (ReBiz citing RetailNext)
- AI-powered scheduling typically delivers 8–12% labor cost reduction without reducing service quality — representing $12,000–$18,000/year savings for a business with $150,000 in annual labor costs
- AI scheduling reduces understaffing during peak periods — the invisible revenue loss (customers who leave without buying due to long checkout queues) — as significantly as it reduces overstaffing costs
Practical application: A restaurant group using POS data to identify that Thursday evenings are consistently 40% busier than the roster assumes can shift staff allocation proactively. The ROI is dual: lower payroll on quieter shifts, higher conversion and customer satisfaction on busier ones.
8. Marketing Attribution and ROI Optimization
What it does: Closes the attribution loop between marketing spend and actual purchase behavior by connecting campaign data to POS transaction records — identifying which specific marketing activities drove which in-store and online sales, rather than relying on digital-only attribution models that ignore physical retail entirely.
Verified outcomes:
- Retailers using AI see 2.9x higher marketing ROI compared to non-AI users (Gitnux)
- AI-driven ad targeting increases advertising efficiency by 15–30% (CareerTrainer AI)
- AI A/B testing for campaigns cuts optimization time by 70% compared to manual testing cycles (Gitnux consumer retail statistics)
- AI-powered predictive analytics for customer segmentation improves campaign ROI by 10–25% across targeted segments
The attribution gap most retailers live with: Digital marketing platforms measure click-through rates and online conversions accurately. They are almost entirely blind to the 60–80% of total retail revenue that closes in a physical store. AI models that connect campaign exposure data to POS transaction records — matching a customer’s email open to their in-store purchase three days later — reveal the true ROI of every channel, including out-of-home, direct mail, and in-store promotions.
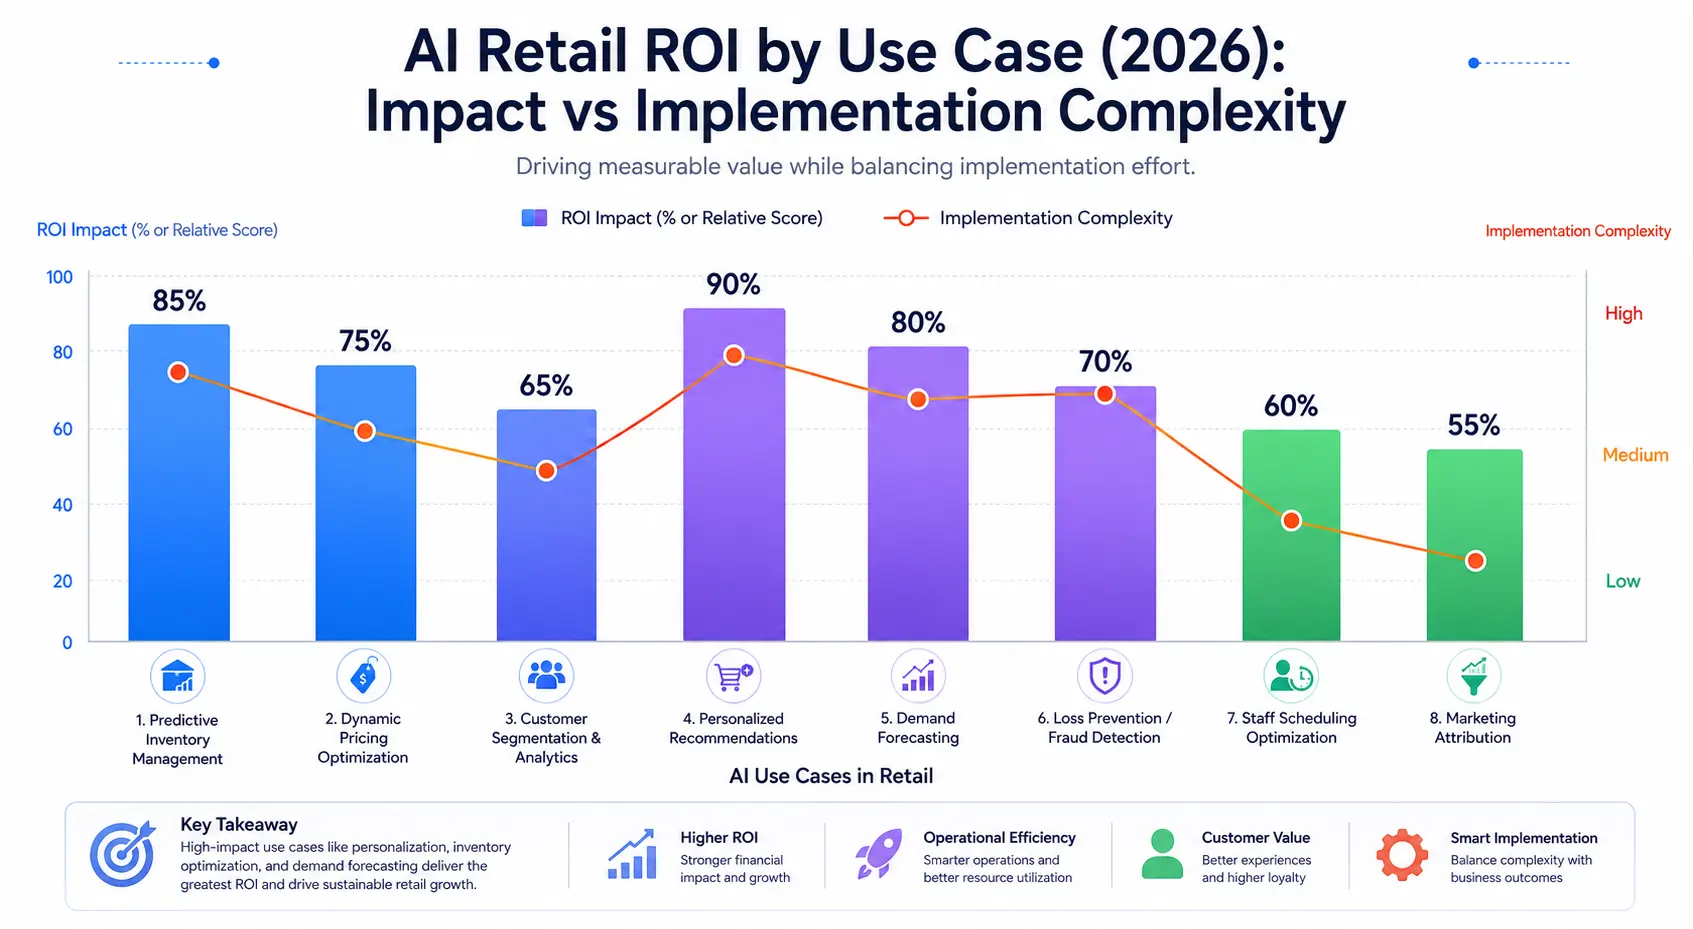
The Business Case — ROI of AI in Retail by Use Case
The data is compelling. But decision-makers need it structured for internal business case building, not scattered across eight sections. Here is the ROI summary table.
| AI Use Case | Typical ROI Impact | Time to Impact | Implementation Complexity | Best Starting Point For |
|---|---|---|---|---|
| Predictive inventory management | 20% revenue increase; 10% inventory cost reduction | 3–6 months | Medium | All retailers with 6+ months POS history |
| Dynamic pricing optimization | 3–6% gross margin improvement | 2–4 months | Medium-High | Retailers with margin pressure |
| Customer segmentation | 10–25% campaign ROI improvement | 3–6 months | Medium | Businesses with loyalty data |
| Personalized recommendations | 10–30% sales lift on targeted SKUs; 10–15% AOV increase | 1–3 months | Low-Medium | Ecommerce + retail hybrids |
| Demand forecasting | 20–50% reduction in forecast errors | 3–6 months | Medium | Multi-location, seasonal retailers |
| Loss prevention / fraud detection | $3.7B industry-wide; 2–4 month payback | 2–4 months | Low | All retailers with POS transaction data |
| Staff scheduling optimization | 8–12% labor cost reduction | 1–3 months | Low | Restaurants, high foot-traffic retail |
| Marketing attribution | 2.9x marketing ROI vs. non-AI | 4–8 months | Medium | Retailers with both digital + physical sales |
One framing from The Thinking Company is worth holding onto: retail delivers the highest AI ROI of any sector — 220% on average. But that average masks enormous variance. The businesses achieving 400%+ returns are those that started with data quality, chose high-impact use cases, and connected model outputs directly to operational systems. The businesses achieving 0% are those who bought dashboards that nobody checked.
What Retail KPIs Should You Track with AI-Powered POS Analytics?
AI doesn’t change what you’re trying to achieve in retail. It changes how precisely you can measure it and how quickly you can act on what you measure. These are the KPIs worth tracking — organized by the three performance dimensions your POS data drives.
Core Transaction KPIs
| KPI | What It Measures | AI Enhancement | Performance Benchmark |
|---|---|---|---|
| Average Order Value (AOV) | Average revenue per transaction | AI recommendation engines lift AOV by 10–15% | Track trend vs. prior period; industry varies |
| Units per Transaction (UPT) | Products per sale | Basket analysis improves cross-sell accuracy | >1.5 apparel; >2.0 grocery; track trend |
| Sell-through Rate | % of inventory sold vs. received per period | Predictive markdown timing optimizes recovery | >80% per season target for apparel |
| Return Rate | % of transactions that result in a return | Anomaly detection flags unusual return patterns | <5% healthy; higher signals quality or fit issues |
| Gross Margin Return on Investment (GMROI) | Revenue generated per dollar of inventory invested | AI inventory optimization improves turns and margin | GMROI >3.0 indicates strong performance |
| Conversion Rate | % of store visitors who make a purchase | AI reduces queue friction; better product availability | Retail average 20–40%; track trend |
Customer KPIs
| KPI | What It Measures | Why AI Makes It Actionable |
|---|---|---|
| Customer Lifetime Value (CLV) | Total projected revenue per customer relationship | AI predicts CLV trajectory early; enables proactive high-value customer management |
| RFM Score | Recency, Frequency, Monetary combined rating | Drives individual-level segmentation; identifies at-risk customers before they lapse |
| Purchase Frequency | Transactions per customer per period | Declining frequency triggers AI churn prevention workflows |
| Customer Acquisition Cost (CAC) | Marketing spend per new customer | AI attribution shows true CAC by channel, including offline |
| Retention Rate | % of customers who return within a defined period | AI segmentation identifies the behaviors that predict retention vs. churn |
Operational KPIs
- Stockout Rate — AI target: below 2% of SKUs at any given time (industry average without AI: 5–8%)
- Inventory Turnover Ratio — AI typically improves by 15–20% through demand forecasting accuracy
- Shrinkage Rate — AI loss prevention benchmark: below 1.5% of revenue (retail industry average: 1.7%)
- Labor Productivity — Transactions and revenue per labor hour; AI scheduling improves by 8–12%
- Forecast Accuracy — % deviation between AI demand forecast and actual sales; well-tuned models achieve 85–95% accuracy
Before AI Can Work — Your Data Readiness Checklist
This section is what separates genuine expert guidance from AI hype. The honest truth is that 80% of retail AI projects fail to deliver expected value — not because the technology doesn’t work, but because the data foundation wasn’t ready when the models were deployed.
Harvard Business Review identifies data quality issues as the primary failure cause, affecting 77% of organizations attempting AI deployment. This is not an edge case — it’s the majority outcome. And it’s entirely preventable.
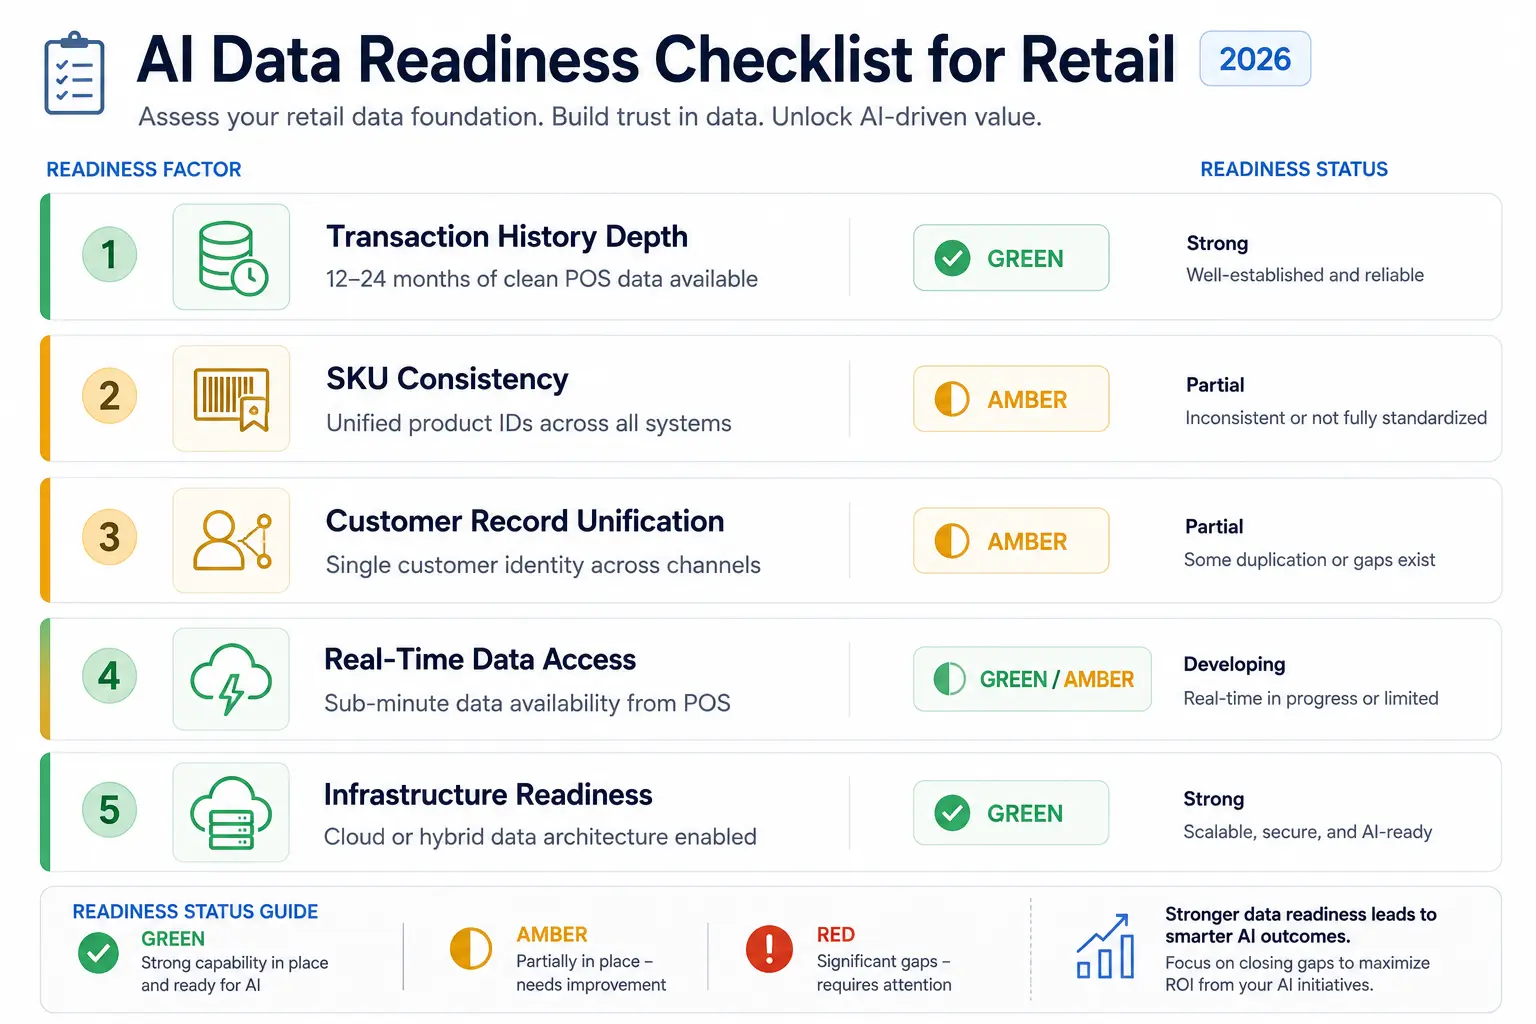
The Five Data Readiness Requirements
| Readiness Factor | What’s Required | Common Gap | How to Fix It |
|---|---|---|---|
| Transaction history depth | Minimum 12 months of clean POS history; 24 months ideal for seasonal businesses | System migrations that lost historical data; data only available in non-exportable formats | Data audit and backfill project; verify your POS exports complete transaction history |
| SKU consistency | Standardized product identifiers across POS, ecommerce, inventory, and warehouse systems | Same product listed as “BLU-JAC-M” in one system and “Blue Jacket Medium” in another | SKU normalization audit across all connected systems |
| Customer record unification | Single customer ID that links in-store and online purchase history | The same customer has a loyalty account in POS and an unlinked ecommerce account | Customer data resolution: match records by email, phone, and purchase behavior |
| Real-time data access | Sub-minute data latency for operational AI use cases | Nightly batch exports only (12–24 hour data lag) | Implement API-based or webhook-driven real-time data pipelines from POS to analytics layer |
| Infrastructure readiness | Cloud or hybrid architecture capable of supporting ML workload execution | On-premise only with no cloud connectivity | Cloud migration or hybrid architecture; see Cloud POS vs On-Premise guide for options |
A Practical Pre-AI Audit Process
Before deploying any AI use case, run a simple audit:
- Export 12 months of transaction data and check completeness — are there gaps from system issues? Are return transactions linked to original purchases?
- List every system that holds customer, inventory, or operational data and map how (or whether) they share identifiers
- Check your inventory data quality — can you report on SKU-level sell-through rate with confidence? If not, your AI models can’t either
- Test your data latency — run a transaction and check how quickly it appears in your reporting system. If the answer is “tomorrow morning,” you have a pipeline problem to solve before deploying real-time AI
Businesses that complete this audit before purchasing any AI tool consistently achieve better outcomes, shorter payback periods, and higher model accuracy than those who skip it.
AI-Powered Retail by Business Type — What to Prioritize
AI’s benefits are universal, but the starting point, priority use cases, and realistic investment vary significantly by business type. Here is practical guidance for each segment.
Small Retail Businesses (1–3 Locations)
The reality check: Small retailers often assume AI is beyond their budget or data scale. It isn’t. The barrier to entry dropped dramatically in 2024–2026 with off-the-shelf AI analytics modules that attach to existing POS platforms for $200–$1,500/month.
Start here: Personalized email recommendations driven by POS purchase history (fastest ROI, lowest complexity), and loss prevention anomaly detection (fastest payback).
Near-term: Demand forecasting for 30–60 day inventory planning — particularly high-value for seasonal businesses where overstock is a significant annual cost.
Realistic investment: $200–$1,500/month for an AI analytics add-on on top of existing SaaS POS. Most small retailers recover this cost within the first 60–90 days through inventory savings and incremental sales uplift.
Restaurant Groups (3–20 Locations)
Priority use cases: Staff scheduling optimization and food waste reduction through demand forecasting deliver the fastest, most measurable ROI for restaurant operators. Labor and food cost together represent 55–65% of restaurant revenue — these are the largest controllable costs in the P&L.
High-value specifics:
- A restaurant processing 300 covers/day with POS data connected to a demand forecasting model can reduce food prep waste by 10–20% — saving $15,000–$40,000/year at a mid-scale operation
- Staff scheduling optimization for a 50-employee restaurant group delivering 8% labor savings reduces annual payroll by $25,000–$60,000 depending on wage rates
Key data source: Kitchen Display System (KDS) data combined with POS transaction timing reveals fulfillment speed, ticket accuracy, and capacity utilization by meal period — the operational AI layer most restaurant tech vendors don’t fully leverage.
Order management and fulfillment software that integrates with both in-house POS and delivery platform data gives restaurant AI models the most complete operational picture.
Multi-Location Retailers (10–50 Locations)
The data advantage: Multi-location operations have the richest AI training data — cross-location patterns, regional demand differences, and location-level operational benchmarking that single-store businesses simply can’t access. This is where AI delivers disproportionately higher returns.
Priority use cases: Location-level demand forecasting (which inventory to hold at which store), cross-location inventory rebalancing (move stock from low-velocity to high-velocity locations before it ages), and customer segmentation driving personalized marketing across channels.
Critical requirement: A unified data layer across all locations is the prerequisite. Fragmented POS data — where each location is essentially its own island — limits AI to location-specific insights and misses the cross-location patterns that generate the most value.
Retail and ecommerce software development designed around this specific need — unified data architecture powering cross-location AI analytics — is where Corexta’s team specializes.
Enterprise Retailers (50+ Locations, $10M+ Annual Revenue)
At enterprise scale, the full spectrum of all eight AI use cases is justified. The ROI math alone compels it.
Consider the Walmart benchmark: AI supply chain optimization saved approximately $75 million in a single fiscal year, with a separate AI inventory rerouting system saving an additional $55 million (Ringly.io citing Mindit). These are not numbers accessible only to trillion-dollar retailers. The same AI architecture, applied proportionally, delivers significant returns at $50M, $100M, and $500M in annual revenue.
The enterprise-specific decision: at scale, custom AI models trained on your proprietary data consistently outperform generic platform models. Your POS history, your customer behavioral patterns, your supplier relationships, your product affinities — these are unique data assets that off-the-shelf models will never fully capture. Custom development of AI models built on your specific data profile is the long-term competitive moat.
For enterprise-grade custom AI POS development, Corexta’s custom POS development services handle the full stack — from data architecture to model training to operational integration.
Ecommerce + Retail Hybrid Businesses
Hybrid businesses have the most powerful AI data foundation available to any retail category: the combination of physical POS behavior (what customers actually buy in-store) and digital behavior (what they browse, add to cart, abandon, and convert online) in one unified dataset.
This cross-channel data enables use cases that pure-play retailers on either channel can’t access:
- Cross-channel attribution: Which in-store product discoveries drove online purchases? Which online research sessions preceded in-store conversions?
- Unified CLV calculation: What is a customer’s true lifetime value across all channels combined — not siloed channel-by-channel?
- Inventory optimization across fulfillment modes: Which SKUs should be stocked in-store for BOPIS, which should be fulfilled from warehouse, and which can be ship-from-store?
The data infrastructure that makes this possible is an integrated omnichannel POS and ecommerce platform — the topic covered in depth in our omnichannel retail POS integration guide. See also custom ecommerce software development for businesses building this integration from the ground up.
Off-the-Shelf AI Analytics vs. Custom AI POS Development — Which Path Is Right?
Once you’ve validated AI’s potential for your business, the next decision is how to deploy it. Two distinct paths exist.
| Factor | Off-the-Shelf AI Analytics Platform | Custom AI POS Development |
|---|---|---|
| Setup timeline | Weeks to 2 months | 3–9 months |
| Upfront investment | Low ($0–$500 setup) | Medium-High ($30,000–$200,000+) |
| Monthly recurring cost | $500–$5,000/month | Low (cloud hosting + 15–20% maintenance) |
| Model accuracy | Good (generic models trained on industry data) | Better (models trained exclusively on your data) |
| Customization | Limited to vendor’s feature roadmap | Fully custom logic, models, and integrations |
| Data ownership | Platform holds model weights and insights | You own the models, training data, and outputs |
| Integration depth | Platform-dependent API connections | Any integration via custom API design |
| Long-term TCO (5 years) | High (subscription compounds; $30K–$300K total) | Lower (no subscription; build cost amortized) |
| Competitive differentiation | None (competitors use same models) | High (proprietary models built on your data) |
| Best for | Businesses validating AI use cases | Businesses with 12+ months clean data and proven ROI |
The recommended sequence for most businesses: Start with an off-the-shelf analytics platform to prove the use case with lower risk and faster deployment. Run it for 12–24 months. Validate which AI capabilities genuinely deliver ROI for your specific business and data profile. Then invest in custom model development — built on your now-proven data assets — to achieve the accuracy, ownership, and competitive differentiation that platform models can’t provide.
For detailed pricing on what custom AI-ready POS development costs at different complexity levels, see our POS software development cost guide.
How to Implement AI Analytics for Your Retail POS — A Practical Roadmap
This five-phase implementation roadmap closes the gap that 100% of competitors leave open. Not just what AI can do — but how to actually build it in your business.
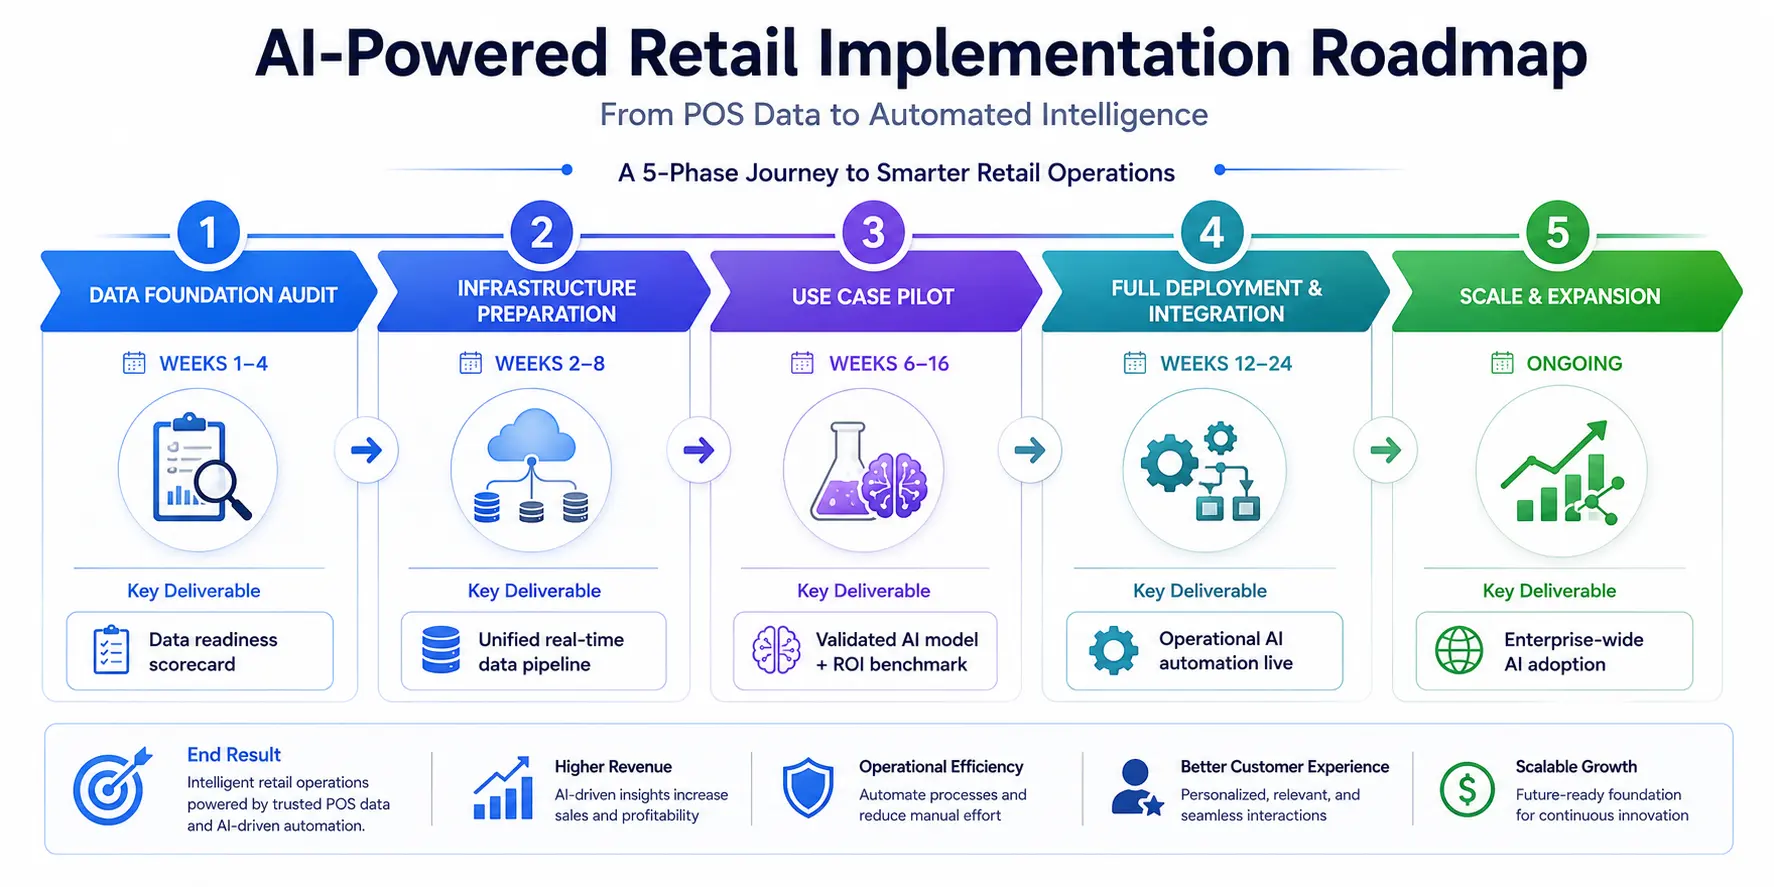
Phase 1 — Data Foundation Audit (Weeks 1–4)
Before any technology purchase, map your current state comprehensively.
Run a complete inventory of every data source in your business: POS system (which platform, how data is exported, what fields are captured), ecommerce platform, loyalty program or CRM, inventory management system, and any warehouse or ERP. For each system, document: How much history exists? Is it clean and complete? Does it share identifiers with other systems?
Deliverable: A data readiness scorecard that tells you exactly which AI use cases are immediately deployable and which require data preparation work first.
Phase 2 — Infrastructure Preparation (Weeks 2–8)
Connect your data sources to a central analytics platform. For businesses on cloud-native POS infrastructure, this typically means configuring API connections to a cloud data warehouse (Snowflake, BigQuery, or AWS Redshift are the most common choices in 2026).
Establish real-time data pipelines — webhook or API-based sync from your POS and ecommerce platforms to the analytics layer. Implement data governance: standardize SKU identifiers across all systems, resolve customer identity conflicts (merge in-store and online customer records), and document the single source of truth for each data type.
Deliverable: A unified, real-time accessible data layer that feeds all AI models from a single, clean source.
Phase 3 — Use Case Pilot (Weeks 6–16)
Select one or two high-ROI, low-complexity use cases for your initial pilot. For most retailers, demand forecasting or personalized product recommendations are the right starting points — both have fast payback periods and require data that most businesses already have in reasonable quality.
Configure or train ML models for the selected use cases. Run a pilot: hold out a portion of historical data, run the model against it, and measure accuracy before deploying against live operational data. Validate that the model’s predictions match real-world outcomes within an acceptable accuracy threshold (target: 85%+ for demand forecasting).
Deliverable: Validated AI model with documented accuracy benchmarks and projected ROI.
Phase 4 — Full Deployment and Operational Integration (Weeks 12–24)
Connect model outputs to operational systems via API. This is the step that transforms AI from an analytics tool into a business automation engine: demand forecasts triggering automatic purchase orders, churn predictions triggering retention email campaigns, inventory rebalancing recommendations routing to store managers as actionable tasks rather than data tables.
Train staff on AI-generated recommendations and exception alerts. Establish model performance monitoring — track accuracy drift over time and schedule retraining intervals (typically quarterly for seasonal businesses).
Deliverable: AI insights feeding directly into operational decisions without requiring manual data review.
Phase 5 — Scale and Expand (Ongoing)
Expand to additional AI use cases based on Phase 3 and 4 ROI validation. Build a company-wide data culture: staff who understand how AI recommendations are generated provide better feedback, catch model errors earlier, and generally improve model quality through higher-quality input data.
For businesses at scale, this phase includes investment in custom model development — transitioning from off-the-shelf platform models to proprietary models trained exclusively on your business’s data patterns.
| Phase | Timeline | Key Deliverable | Relative Cost |
|---|---|---|---|
| Data Foundation Audit | Weeks 1–4 | Data readiness scorecard | 5–8% of total |
| Infrastructure Preparation | Weeks 2–8 | Unified real-time data layer | 15–20% |
| Use Case Pilot | Weeks 6–16 | Validated model + ROI benchmark | 25–35% |
| Full Deployment + Integration | Weeks 12–24 | Operational AI automation | 30–40% |
| Scale and Expand | Ongoing | Full use case portfolio | Maintenance + iteration |
The Future of AI in Retail — What’s Coming in 2026 and Beyond
The AI capabilities described in this guide are what’s available and proven today. What comes next is already in development — and understanding it helps you build infrastructure now that won’t require rebuilding in three years.
1. Agentic AI — From Insight to Autonomous Action
The most significant near-term shift in retail AI is the move from decision support to autonomous decision execution. Agentic AI systems don’t generate a recommendation for a human to approve — they act. Inventory replenishment orders submit themselves. Pricing updates deploy themselves. Promotional campaigns activate themselves based on real-time behavioral signals.
A new buyer profile is emerging: what Complete AI Training calls “machine customers” — devices and AI agents that reorder household essentials without human input. Retailers whose POS and ecommerce systems expose clean, real-time APIs to these agentic systems will participate in this distribution channel. Those without API-first infrastructure won’t.
2. Generative AI in Retail Operations
Generative AI reduces content creation time for retail marketing by up to 40% (CareerTrainer AI). Beyond marketing copy, generative AI creates product descriptions at scale, generates personalized promotional imagery, produces AI-driven planogram recommendations, and synthesizes natural-language performance summaries from complex multi-dimensional data. The operational efficiency implications for multi-location retailers managing large product catalogs are substantial.
3. AI at the Edge — Real-Time POS-Level Intelligence
Edge computing brings AI inference directly to the POS terminal — eliminating the round-trip to cloud servers that creates latency in real-time applications. Instant fraud detection, sub-second personalized recommendations at checkout, and real-time dynamic pricing updates that reflect a competitor’s price change within minutes all become possible through edge AI architecture. This is where cloud, on-premise, and hybrid POS architecture choices directly determine your AI capability ceiling.
4. First-Party Data as a Compounding Competitive Advantage
As third-party cookies disappear entirely from digital advertising and platform targeting weakens, retailers with rich POS-anchored first-party data accumulate a growing competitive advantage. Every transaction becomes a valuable data point that strengthens future analysis. Over time, each year of operation improves model accuracy by adding more behavioral and purchasing data. Customer interactions further enrich your understanding of buying patterns, creating insights that competitors without your data simply cannot replicate.
The retailer with the deepest, cleanest first-party data today will have the most accurate AI models in 2027, 2028, and 2029. This is a compounding advantage that starts accruing the moment you begin structuring your POS data correctly.
5. Investment Is Accelerating, Not Plateauing
AI spending in retail is on track to reach $19.9 billion globally in 2026, up from $6.4 billion in 2021 — a CAGR of 25.2%. For context: that growth rate means total retail AI investment nearly quadruples every five years. The window for differentiation through early adoption is still open. Based on adoption rates, 2026 represents the last year where AI-powered retail analytics is a competitive differentiator for the majority of retailers. By 2028, it will be a baseline operational requirement.
Frequently Asked Questions About AI-Powered Retail
What is AI-powered retail?
AI-powered retail uses artificial intelligence and machine learning to transform raw POS transaction data — every sale, return, product interaction, and customer record — into actionable business intelligence. Rather than reviewing historical reports, AI-powered systems generate real-time demand forecasts, personalized customer promotions, dynamic pricing recommendations, and automated inventory reorder triggers — often without requiring human review of each decision. The result is faster, more accurate operational decisions across inventory, pricing, marketing, and staffing.
How does AI use POS data to improve retail decisions?
AI uses POS data through a five-stage pipeline: ingesting transaction streams in real time, cleaning and structuring the data into model-ready features, training machine learning models on historical patterns, generating predictions and recommendations from current data, and connecting those outputs to operational systems that execute automatically. A demand forecast, for example, draws on 12+ months of POS sales velocity, combined with weather forecasts and promotional calendars, to predict SKU-level stock requirements 30–60 days forward and trigger purchase orders automatically.
What insights can retailers get from POS transaction data?
POS data enables four categories of retail insight. Transaction insights reveal which products sell together (market basket), which time periods drive peak demand, and which price points optimize conversion. Customer insights show purchase frequency, category affinity, churn risk, and CLV trajectory. Inventory insights surface stock velocity, shrinkage signals, and reorder timing. Operational insights identify staff productivity patterns, transaction speed benchmarks, and fraud behavioral signatures. When combined with external data (weather, events, competitor pricing), the predictive power of POS data compounds significantly.
How does AI improve inventory management in retail?
AI improves inventory management by replacing reactive, intuition-based restocking with proactive, data-driven demand forecasting. ML models trained on POS sales history, seasonal patterns, and external signals predict SKU-level demand 30–90 days forward with 85–95% accuracy in well-tuned systems. This prevents the two primary inventory failures: stockouts (which cost sales) and overstock (which costs margin through markdowns). Research shows AI-driven inventory management reduces stockouts by 50% and overstocks by 25%, while decreasing total inventory carrying costs by approximately 10%.
Can AI predict customer buying behavior?
Yes — with measurable accuracy. AI models trained on POS purchase history, RFM scores, product affinity signals, and behavioral patterns can predict purchase propensity for specific products, churn probability within a defined time period, response probability to specific promotion types and discount levels, next-category purchase likelihood based on current purchase patterns, and optimal timing for re-engagement campaigns. These predictions become inputs to personalization engines that deliver relevant experiences automatically, without requiring manual segmentation analysis.
What are the benefits of retail analytics for small businesses?
For small retailers, the most accessible AI analytics benefits are: fraud and loss prevention (typically 2–4 month payback, lowest complexity), personalized email recommendations driven by purchase history (10–15% AOV lift with minimal setup), and basic demand forecasting for inventory planning (reducing overstock and stockout costs). Off-the-shelf AI analytics platforms now start at $200–$500/month, making these capabilities accessible without a data science team. The prerequisite is 12+ months of clean, exportable POS transaction history.
How does AI help increase retail sales?
AI increases retail sales through five primary mechanisms: personalized product recommendations that lift average order value by 10–15%, dynamic pricing that captures revenue at optimal price points rather than leaving margin on the table, churn prevention that retains high-value customers before they lapse, demand forecasting that ensures the right products are available when customers want them, and marketing attribution that identifies which channels actually drive sales — enabling smarter reallocation of marketing budget toward higher-ROI activities.
What is predictive analytics in retail?
Predictive analytics in retail is the use of machine learning models trained on historical POS transaction data to forecast future events — demand volumes, customer behavior, stock depletion timing, and promotional response rates — before they occur. Unlike descriptive analytics (what happened) or diagnostic analytics (why it happened), predictive analytics answers “what will happen next?” and prescriptive analytics answers “what should we do about it?” Modern AI systems achieve 20–50% reduction in demand forecasting errors compared to traditional statistical methods, according to research from McKinsey and Harvard Business Review.
What retail KPIs should businesses track with AI analytics?
The most important KPIs for AI-powered retail analytics are: Average Order Value (AOV) and Units per Transaction (UPT) for transaction performance; Customer Lifetime Value (CLV), RFM Score, and Purchase Frequency for customer health; Sell-through Rate and GMROI for inventory performance; Stockout Rate (target: below 2%) and Inventory Turnover for supply chain efficiency; and Shrinkage Rate for loss prevention. AI enhances each of these by providing real-time visibility, predictive early-warning signals, and automated triggers when metrics breach acceptable thresholds.
What is the future of AI in retail?
The future of AI in retail is moving in five directions simultaneously: agentic AI systems that act autonomously (not just recommend), generative AI that creates marketing content and operational summaries at scale, edge AI that brings real-time intelligence directly to the POS terminal, first-party data compounding as third-party targeting weakens, and accelerating investment with AI spending in retail projected to reach $19.9 billion globally in 2026 and growing at 25% CAGR. By 2028, AI-powered retail analytics will be a baseline operational requirement rather than a competitive differentiator — making 2026 the last optimal window for early-adoption advantage.
Build Your AI-Ready Retail Intelligence Platform with Corexta
AI-powered retail doesn’t begin with an analytics platform subscription. It begins with a POS system and data infrastructure designed from the ground up to capture, structure, and expose the transaction data that AI models actually need.
Corexta builds the systems that make retail AI possible — from AI-ready custom POS architecture to unified inventory and order management platforms — for retail businesses and restaurant groups that have outgrown the data limitations of off-the-shelf solutions.
Our services that power AI-ready retail infrastructure:
- Custom POS Development — POS systems built with real-time data pipelines, structured transaction data, and AI integration architecture from day one. Not a checkout tool with a reporting module bolted on.
- Retail & Ecommerce Software Development — Unified retail and ecommerce platforms that create the cross-channel data foundation retail AI requires to be genuinely accurate.
- Custom Ecommerce Software Development — API-first ecommerce infrastructure that feeds behavioral and transaction data to your AI analytics layer in real time.
- Custom Inventory Management Software — SKU-level, location-level inventory systems that connect directly to AI demand forecasting models.
- Order Management & Fulfillment Software — Fulfillment automation that receives AI demand forecast outputs and executes procurement, routing, and replenishment automatically.
Further reading to complete your knowledge:
- How Much Does POS Software Development Cost in 2026? — Realistic custom POS budgeting
- Omnichannel Retail: POS & Ecommerce Integration Guide — The data foundation for retail AI
- Cloud POS vs On-Premise POS: Which Is Right for Your Business? — The infrastructure decision that determines your AI capability ceiling
Get a free AI readiness assessment for your retail POS →
We’ll review your current POS data architecture, identify the specific AI use cases your existing data already supports, and map the infrastructure gaps that would need to close before you can deploy the highest-ROI capabilities. No commitment. No generic demo. A real conversation about your data and your business.
Key Takeaways
- The global AI in retail market reached $18.4 billion in 2026, with 89% of retailers now using or testing AI and 58% in full active deployment.
- Your POS system captures four data layers — transaction, inventory, customer, and operational — that form the raw material for every AI use case.
- AI transforms this data through a five-stage pipeline from ingestion to automated action — connecting model outputs directly to operational systems rather than dashboards for human review.
- The eight highest-ROI AI use cases are: predictive inventory management, dynamic pricing, customer segmentation, personalized recommendations, demand forecasting, loss prevention, staff scheduling, and marketing attribution — with ROI ranging from 8% labor cost reduction to 400%+ from personalization at scale.
- 80% of AI projects fail due to data quality issues, not technology failure — completing a data readiness audit before deployment is the most important step most businesses skip.
- The right implementation sequence: data foundation → infrastructure preparation → pilot (1–2 use cases) → full operational deployment → scale.
- Off-the-shelf AI analytics platforms are the right starting point; custom AI development becomes the better investment once use cases are validated and data volume justifies proprietary model training.
- AI retail infrastructure is a compounding competitive advantage — the businesses that build it in 2026 will have more accurate models, better customer intelligence, and more automated operations in every year that follows.