In an increasingly competitive digital landscape, businesses can no longer rely on intuition or assumptions to guide important decisions. Small changes to a website, email campaign, or app interface can significantly impact user behavior, conversions, and revenue—but only if those changes are tested and validated properly. This is where A/B testing becomes an essential tool for modern organizations.
A/B testing allows businesses to compare two or more variations of an element to understand which version performs better based on real user data. Instead of guessing what customers prefer, teams can observe actual behavior and use measurable outcomes to guide optimization efforts. From improving website conversions and email open rates to refining mobile app experiences and marketing messages, A/B testing provides clarity in decision-making.
This guide explores the foundations of A/B testing, explains why it is critical for better business decisions, and breaks down its benefits and key components. By understanding how A/B testing works and what makes a test reliable, businesses can create experiments that lead to meaningful improvements and long-term growth.
What Is A/B Testing?
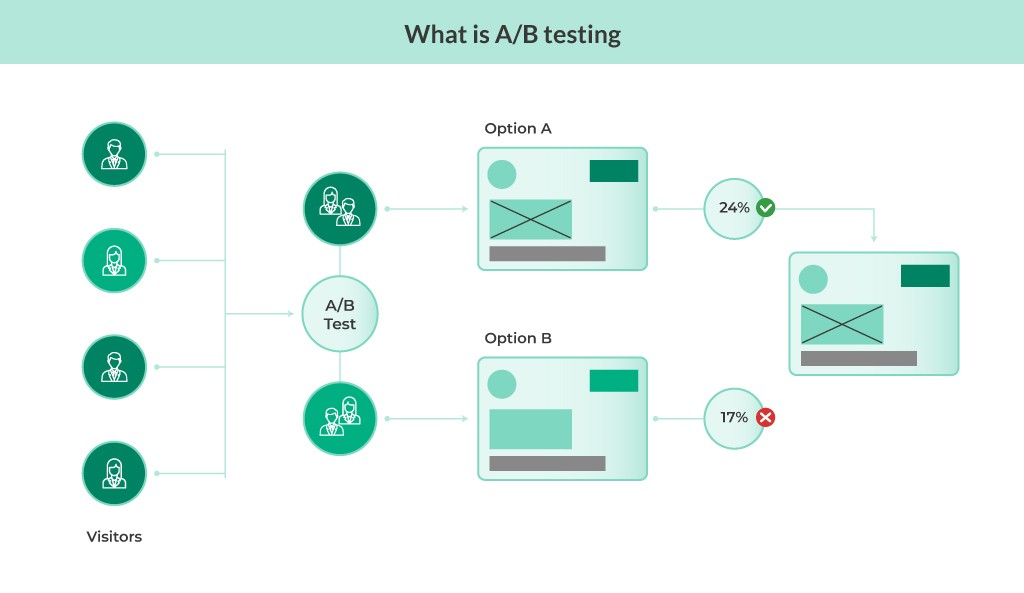
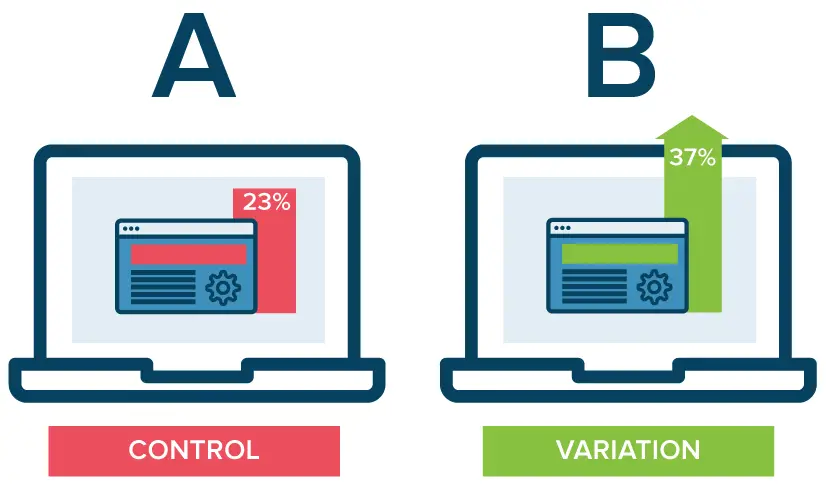
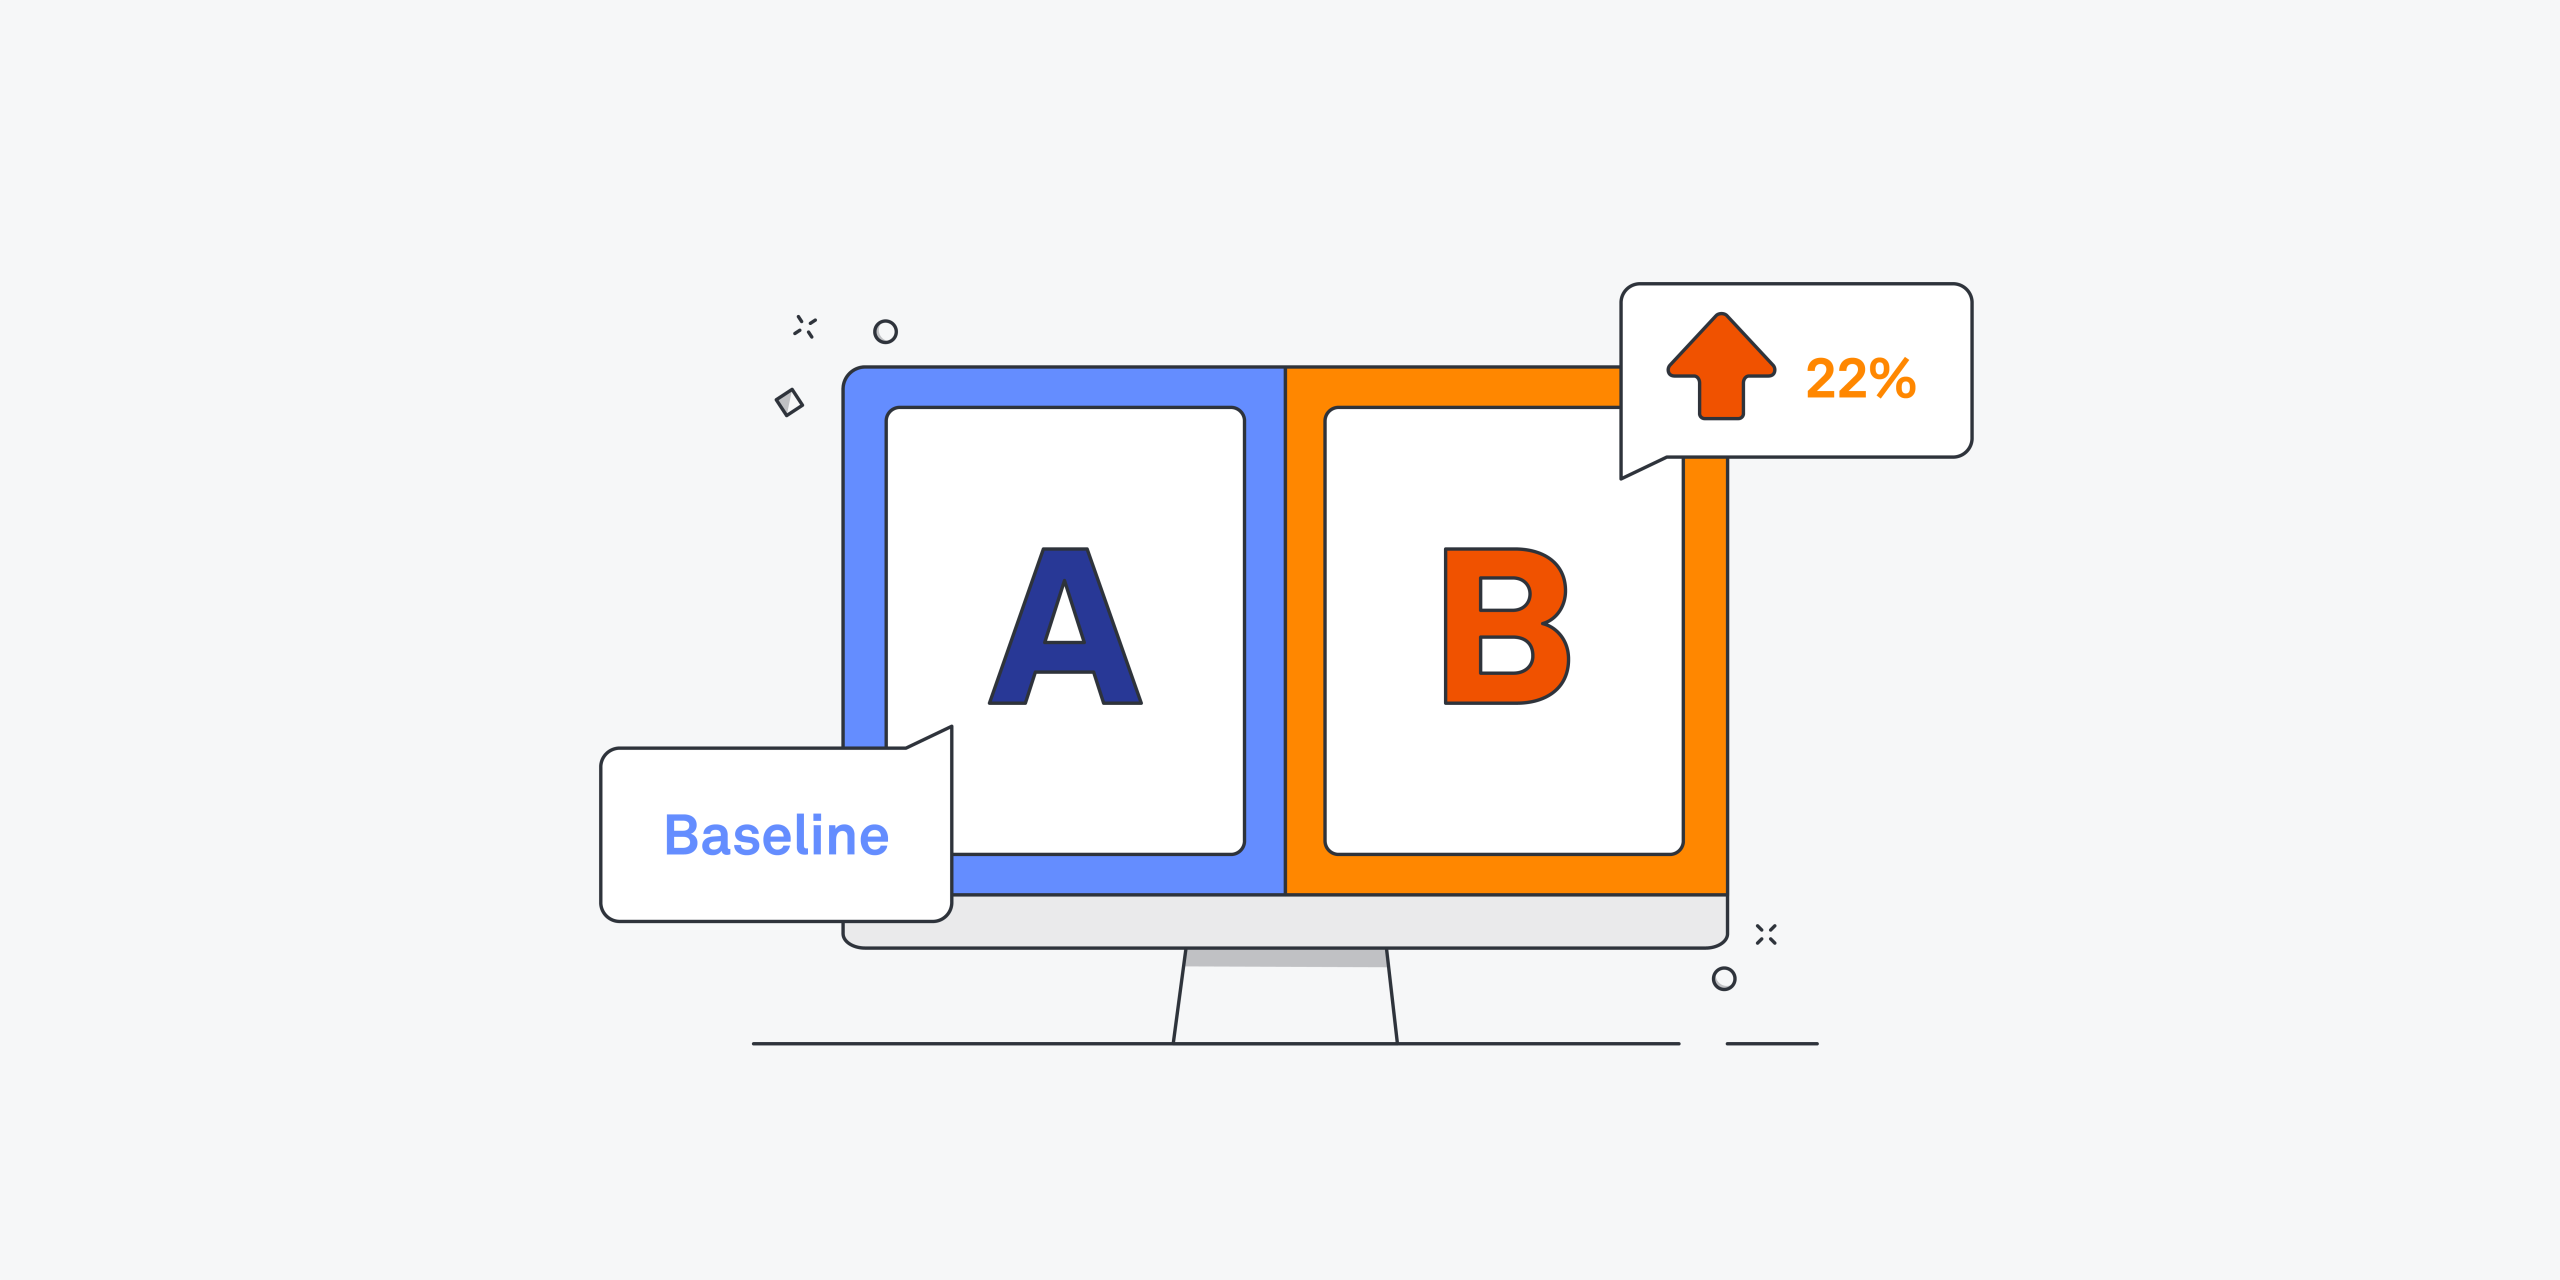
A/B testing, also known as split testing, is a controlled experimentation method used to compare two versions of a digital asset to determine which one performs better against a defined objective. In a typical A/B test, users are randomly divided into two groups. One group is shown the original version (often called the control), while the other group sees a modified version (the variation). User behavior is then measured to identify which version delivers better results.
The key strength of A/B testing lies in its simplicity and precision. By changing only one variable at a time—such as a headline, button color, call-to-action text, or layout—businesses can isolate the impact of that specific change. This eliminates confusion caused by multiple variables and ensures the results are attributable to the tested element.
A/B testing is widely used across different business functions. Marketing teams test email subject lines, landing pages, and ad creatives. Product teams experiment with onboarding flows, feature placements, and navigation structures. E-commerce businesses test pricing displays, product descriptions, and checkout processes. In each case, the goal is the same: improve performance based on real user behavior rather than assumptions.
When executed correctly, A/B testing reduces risk, increases confidence in decisions, and helps teams continuously optimize experiences in a structured, repeatable way.
Benefits of A/B Testing
Measure User Engagement
One of the most valuable benefits of A/B testing is its ability to measure user engagement accurately. Engagement metrics such as click-through rates, scroll depth, time on page, form interactions, and feature usage provide insight into how users respond to different experiences.
By testing variations, businesses can identify which design elements, copy, or layouts encourage users to interact more deeply. For example, a small change in button wording may significantly increase clicks, or a redesigned layout might keep users on a page longer. These insights help teams understand user preferences and behavior patterns that are otherwise difficult to predict.
A/B testing transforms engagement measurement from guesswork into a structured analysis, making it easier to optimize experiences that resonate with users.
Make Data-Driven Decisions
A/B testing supports a data-driven culture by replacing subjective opinions with measurable evidence. Decisions based on personal preferences, internal debates, or assumptions often lead to inconsistent outcomes. A/B testing shifts the focus to objective results derived from real user interactions.
When stakeholders can see clear performance differences between variations, alignment becomes easier. Teams gain confidence in their decisions because they are backed by data rather than speculation. Over time, this approach improves decision quality and reduces the likelihood of costly mistakes.
Data-driven decision-making also encourages experimentation and learning. Even tests that fail to produce positive results provide valuable insights that inform future strategies.
Increase Conversion Rates
Improving conversion rates is one of the most common goals of A/B testing. Conversions can represent purchases, sign-ups, downloads, form submissions, or any action that contributes to business objectives.
A/B testing allows businesses to optimize each step of the user journey by identifying friction points and opportunities for improvement. Testing headlines, calls to action, form fields, pricing layouts, and trust signals can lead to measurable increases in conversions without increasing traffic or advertising spend.
Over time, incremental gains from multiple successful tests can compound into significant revenue growth, making A/B testing a cost-effective optimization strategy.
Simplify Analysis
Compared to more complex experimentation methods, A/B testing offers a straightforward way to analyze results. By focusing on a single variable and comparing two versions, teams can clearly attribute performance changes to specific modifications.
This simplicity reduces the risk of misinterpretation and makes results easier to communicate across teams. Clear success metrics and controlled conditions help ensure that insights are actionable rather than ambiguous.
Simplified analysis also enables faster iteration. Teams can quickly move from insights to implementation, accelerating the optimization cycle.
Get Instant Results
A/B testing provides timely feedback, especially in environments with high traffic or frequent user interactions. Once a test reaches a sufficient sample size, teams can quickly identify trends and performance differences.
This rapid feedback loop allows businesses to respond to user behavior in near real time. Instead of waiting weeks or months to evaluate the impact of changes, teams can make informed decisions faster and stay agile in competitive markets.
While not every test delivers immediate results, the ability to gather actionable insights within a short timeframe is a significant advantage.
Test All Elements
A/B testing is highly versatile and can be applied to nearly every aspect of a digital experience. From visual design elements and written content to functional features and user flows, almost anything can be tested.
Businesses can experiment with headlines, images, layouts, navigation menus, pricing displays, onboarding steps, and more. This flexibility allows teams to optimize holistically rather than focusing on isolated areas.
By continuously testing different elements, organizations can create experiences that evolve alongside user expectations and market trends.
Key Components of A/B Testing

Hypothesis
A hypothesis is the foundation of any successful A/B test. It is a clear, testable statement that defines what change is being made, why it is being made, and what outcome is expected.
A strong hypothesis is based on data, observations, or user feedback rather than assumptions. It typically follows a structured format: changing a specific element is expected to produce a measurable improvement in a defined metric. This clarity helps guide test design and ensures results are interpreted correctly.
Variation and Control Groups
In A/B testing, the control group represents the original version, while the variation group contains the modified version. Users are randomly assigned to one of these groups to ensure unbiased results.
Randomization is critical because it helps eliminate external factors that could influence behavior. By exposing both groups to similar conditions, any performance differences can be attributed to the tested change rather than external variables.
Maintaining consistency between control and variation groups ensures the integrity of the test.
Sample Size
Sample size refers to the number of users included in an A/B test. A sufficiently large sample is essential for achieving statistically reliable results.
If the sample size is too small, results may be misleading or inconclusive. Larger samples reduce the impact of random fluctuations and increase confidence in the findings. Determining the appropriate sample size depends on factors such as traffic volume, expected effect size, and desired confidence level.
Planning sample size in advance helps prevent premature conclusions and unreliable insights.
Blinding
Blinding involves limiting awareness of test variations to reduce bias. While users are typically unaware they are part of an experiment, internal teams may also benefit from partial blinding during analysis.
By minimizing preconceived expectations, blinding helps ensure results are evaluated objectively. This is especially important in organizations where stakeholders have strong opinions about design or messaging choices.
Blinding supports more accurate interpretation and decision-making.
Duration
Test duration refers to how long an A/B test runs. Ending a test too early can lead to inaccurate conclusions, while running it too long may delay implementation of improvements.
The ideal duration depends on traffic volume, user behavior cycles, and business context. Tests should run long enough to capture representative data across different days, user segments, and usage patterns.
Properly planned duration ensures results reflect consistent trends rather than temporary fluctuations.
Primary Metric
The primary metric is the main success indicator used to evaluate test performance. It should align directly with the test objective and business goals.
Examples of primary metrics include conversion rate, click-through rate, revenue per user, or task completion rate. Choosing a clear primary metric keeps analysis focused and prevents confusion during result evaluation.
A well-defined primary metric makes it easier to determine whether a test was successful.
Secondary Metrics
Secondary metrics provide additional context and insights beyond the primary metric. They help teams understand broader impacts of a change, such as engagement, retention, or user satisfaction.
While secondary metrics should not override the primary objective, they can reveal unintended consequences or supporting trends. Monitoring multiple metrics ensures a more comprehensive evaluation of test outcomes.
Analysis Method
The analysis method defines how test results are evaluated and compared. This typically involves statistical techniques to determine whether observed differences are significant rather than due to chance.
Clear analysis methods help teams interpret results accurately and avoid common pitfalls such as confirmation bias or overconfidence. Consistent analysis standards also make it easier to compare results across multiple tests.
A structured approach to analysis ensures decisions are grounded in reliable evidence.
Reporting Process
The reporting process documents test objectives, setup, results, and conclusions. Clear reporting ensures transparency and enables knowledge sharing across teams.
Well-documented reports help organizations build an experimentation knowledge base, learn from past tests, and refine future strategies. Reporting also supports stakeholder communication by clearly explaining what was tested, what was learned, and what actions are recommended.
A strong reporting process turns individual experiments into long-term organizational learning.
A/B Testing Process
A structured A/B testing process ensures that experiments produce reliable, actionable insights rather than misleading results. Each step builds on the previous one, helping teams move from observation to optimization with clarity and confidence. Skipping steps or rushing decisions often leads to incorrect conclusions, so following a disciplined process is essential for long-term success.
Step #1: Collect Data
The A/B testing process begins with data collection. This step focuses on understanding how users currently interact with your website, app, or campaign. Behavioral data such as page views, bounce rates, click-through rates, heatmaps, session recordings, funnel drop-offs, and conversion paths help identify areas that need improvement.
Data collection should also include qualitative inputs like user feedback, support tickets, surveys, and usability testing insights. These signals often reveal friction points or unmet expectations that are not immediately obvious in quantitative data alone.
The goal of this step is to identify problems worth solving. Instead of testing randomly, teams should prioritize areas where improvements can have a meaningful business impact.
Step #2: Generate Hypothesis
Once data highlights an opportunity, the next step is to create a clear and testable hypothesis. A hypothesis defines what change will be made, why it is expected to work, and what metric will be affected.
Strong hypotheses are grounded in evidence from the data collection phase. They avoid vague assumptions and instead focus on specific user behavior. For example, if users abandon a form at a particular step, the hypothesis may propose simplifying that step to reduce friction.
A well-defined hypothesis aligns the team around a shared objective and sets clear expectations for what success looks like.
Step #3: Create Variations
After defining the hypothesis, teams create test variations. This involves designing an alternative version of the original experience that reflects the proposed change. The original version acts as the control, while the modified version becomes the variation.
It is critical to change only one variable at a time. This could be a headline, call-to-action text, layout, color, image, pricing format, or feature placement. Isolating a single variable ensures that performance differences can be directly attributed to that change.
Variations should be realistic, aligned with brand guidelines, and technically sound to avoid introducing errors that could skew results.
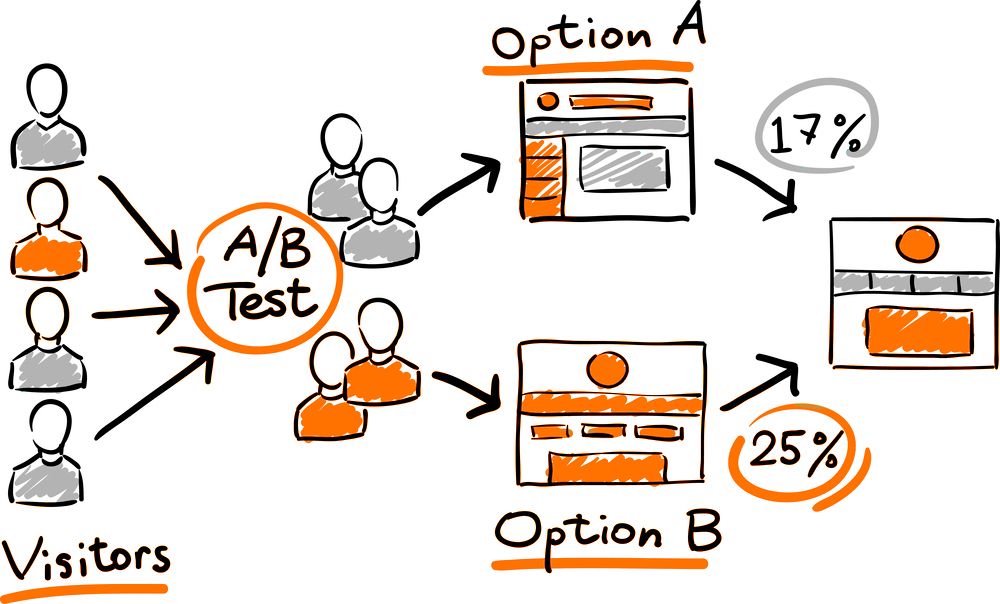
Step #4: Run the Test
Once variations are ready, the test is launched by randomly splitting users between the control and variation groups. Randomization ensures that both groups experience similar conditions, reducing bias and external influence.
During this phase, it is important to monitor the test for technical issues but avoid making changes mid-test. Interfering with a running experiment can compromise data integrity and invalidate results.
Tests should be run consistently across devices, browsers, and user segments to ensure the results reflect real-world usage.
Step #5: Wait for Results
Patience is essential in A/B testing. Ending a test too early can lead to false conclusions based on incomplete data or temporary trends. Tests must run long enough to reach a statistically meaningful sample size and capture natural variations in user behavior.
This waiting period allows patterns to stabilize and ensures that results are not influenced by short-term anomalies such as promotions, holidays, or traffic spikes. Teams should rely on predefined stopping criteria rather than emotional reactions to early performance changes.
Waiting for reliable results protects decision-making accuracy.
Step #6: Analyze Test Results
After the test concludes, results are analyzed against the primary and secondary metrics defined earlier. This step determines whether the variation performed better, worse, or the same as the control.
Analysis should focus on statistical significance, effect size, and practical impact. A statistically significant improvement may still be too small to justify implementation, while a non-significant result may highlight valuable user insights.
Beyond declaring a winner, teams should document learnings, unexpected outcomes, and potential follow-up tests. Even failed tests contribute to deeper understanding and future optimization strategies.
A/B Testing Kits for Marketers
A/B testing kits help marketers streamline experimentation by providing ready-made frameworks, templates, and tools. These kits often include hypothesis templates, metric selection guides, test planning checklists, and reporting formats.
Using a standardized kit reduces setup time, improves consistency, and helps teams avoid common testing mistakes. For marketers running frequent experiments across campaigns, landing pages, or emails, testing kits ensure that every experiment follows best practices and produces reliable insights.
By combining a structured process with the right tools, marketers can scale experimentation efforts and continuously improve performance across channels.
Real-World A/B Testing Examples
Real-world A/B testing examples show how experimentation translates theory into measurable business outcomes. Across websites, emails, social media platforms, and mobile applications, organizations use A/B testing to validate ideas, reduce risk, and improve user experiences. The following examples illustrate how structured testing helps teams make confident decisions based on actual user behavior rather than assumptions.
1. Website A/B Testing Examples
Website A/B testing focuses on optimizing on-page elements that directly influence engagement, usability, and conversions. These tests often involve layout changes, messaging adjustments, navigation improvements, or calls to action.
Grene

Grene used A/B testing to optimize its website experience by focusing on clarity and usability. The primary challenge was helping users quickly understand product value and navigate efficiently through the site. The test compared a more content-heavy layout with a simplified version that emphasized key product categories and clearer calls to action.
The variation reduced visual clutter and prioritized essential information above the fold. As a result, users were able to find relevant products faster, leading to improved engagement and smoother navigation paths. This test demonstrated how simplifying design and reducing cognitive load can positively influence user behavior.
The takeaway from this example is that website optimization is not always about adding more content. Sometimes, removing distractions and presenting information more clearly delivers better results.
ShopClues

ShopClues conducted A/B tests on its product listing and checkout flow to reduce drop-offs and increase completed purchases. The experiment focused on how pricing, discounts, and trust signals were displayed throughout the buying journey.
One variation emphasized discount visibility and simplified the checkout steps, while the control version followed the original design. The test revealed that users responded more positively when savings were clearly highlighted and the checkout process appeared shorter and less complex.
This example highlights the importance of testing assumptions about what motivates users to complete transactions. Small visual and structural changes can significantly impact purchasing behavior.
Beckett Simonon

Beckett Simonon used A/B testing to refine its homepage messaging and call-to-action strategy. The brand wanted to understand whether emphasizing craftsmanship or value would resonate more with visitors.
The control version focused on product quality and materials, while the variation highlighted affordability and long-term value. By testing these messaging approaches, the team was able to identify which narrative aligned better with user expectations and led to higher engagement.
This example shows how A/B testing can guide brand communication by revealing what truly matters to customers, helping businesses align messaging with user priorities.
World Wildlife Federation

The World Wildlife Federation applied A/B testing to optimize donation pages and increase supporter contributions. The organization tested variations in imagery, copy tone, and donation prompts to understand what encouraged users to take action.
One variation focused on emotional storytelling, while another emphasized urgency and impact. The results demonstrated that subtle differences in messaging and presentation could influence donor behavior significantly.
This example underscores the value of A/B testing beyond e-commerce. Nonprofits and mission-driven organizations can also use experimentation to maximize impact and support engagement.
2. Email A/B Testing Examples
Email A/B testing helps organizations improve open rates, click-through rates, and overall campaign effectiveness. Common test elements include subject lines, preview text, email copy, design, and call-to-action placement.
MailerLite
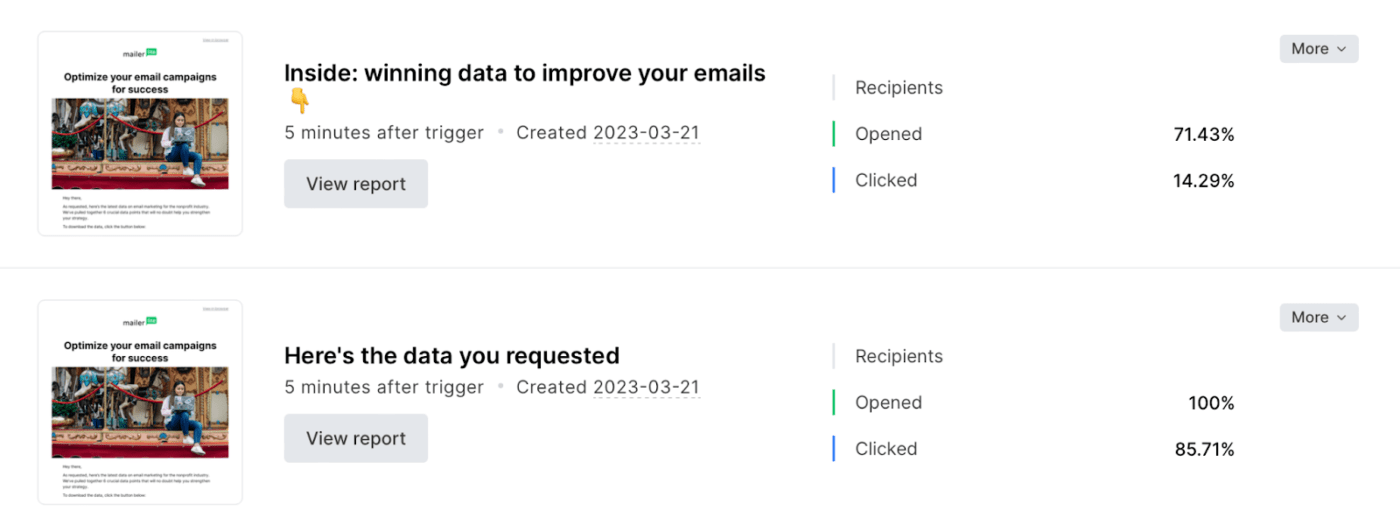
MailerLite conducted email A/B tests to optimize subject lines and content layout. The goal was to identify which combinations drove higher open rates and engagement without overwhelming recipients.
One test compared concise subject lines with more descriptive ones, while another evaluated different call-to-action placements within the email body. The results showed that clarity and relevance were more important than creativity alone. Emails with straightforward messaging and a single, clear call to action consistently performed better.
This example illustrates how A/B testing helps email marketers refine communication strategies by focusing on what resonates with subscribers rather than relying on assumptions.
3. Social Media A/B Testing Examples
Social media A/B testing enables brands to optimize creative assets, messaging styles, and posting strategies. These tests help improve engagement, reach, and conversions across platforms.
Vestiaire
Vestiaire used A/B testing to evaluate different visual styles and messaging approaches in social media campaigns. The test compared lifestyle imagery with product-focused visuals to determine which generated higher engagement.

The results showed that imagery reflecting real-world usage and aspirational contexts performed better than static product images. This insight helped the brand refine its creative strategy and produce content that felt more authentic and relatable to its audience.
This example demonstrates how A/B testing can guide creative direction and content strategy on social platforms.
Palladium Hotel Group
Palladium Hotel Group applied A/B testing to social media ads promoting travel experiences. The team tested variations in headlines, imagery, and call-to-action language to understand what motivated users to click and explore offers.
One variation highlighted luxury and relaxation, while another emphasized exclusive deals and limited-time offers. The findings revealed that urgency-driven messaging was more effective for certain audience segments, while experience-focused messaging worked better for others.
This example shows how A/B testing supports audience segmentation and personalized messaging on social media.
La Redoute
La Redoute used A/B testing to optimize social media posts and advertisements by experimenting with copy length and visual hierarchy. The brand wanted to determine whether short, bold messaging or more descriptive captions performed better.
The test results indicated that concise messaging paired with strong visuals led to higher engagement rates. This insight allowed the team to standardize content formats that aligned with user preferences and platform behavior.
The lesson here is that even small changes in content presentation can significantly affect social media performance.
4. Mobile A/B Testing Examples
Mobile A/B testing focuses on optimizing in-app experiences, onboarding flows, feature adoption, and user retention. Because mobile users have limited attention spans, even minor improvements can deliver meaningful results.
Simply
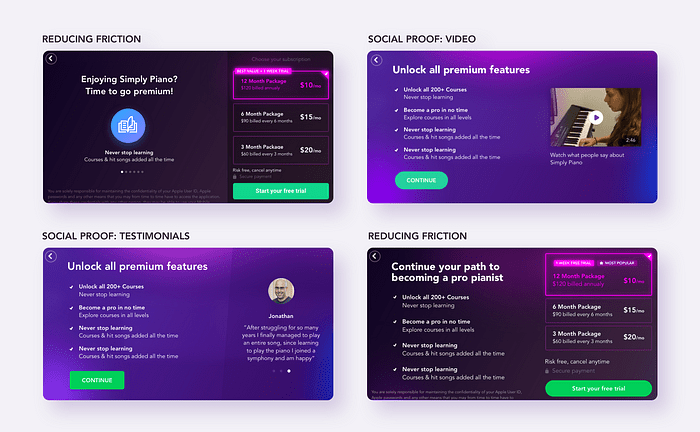
Simply used A/B testing to improve its mobile onboarding experience. The team tested different onboarding flows to understand which approach helped users reach value faster.
One variation reduced the number of steps and emphasized immediate interaction, while the control version followed a more detailed introduction. The streamlined onboarding flow led to higher completion rates and improved early engagement.
This example highlights how A/B testing helps mobile teams balance information delivery with usability, ensuring users are not overwhelmed during their first interactions.
Hospitality Net
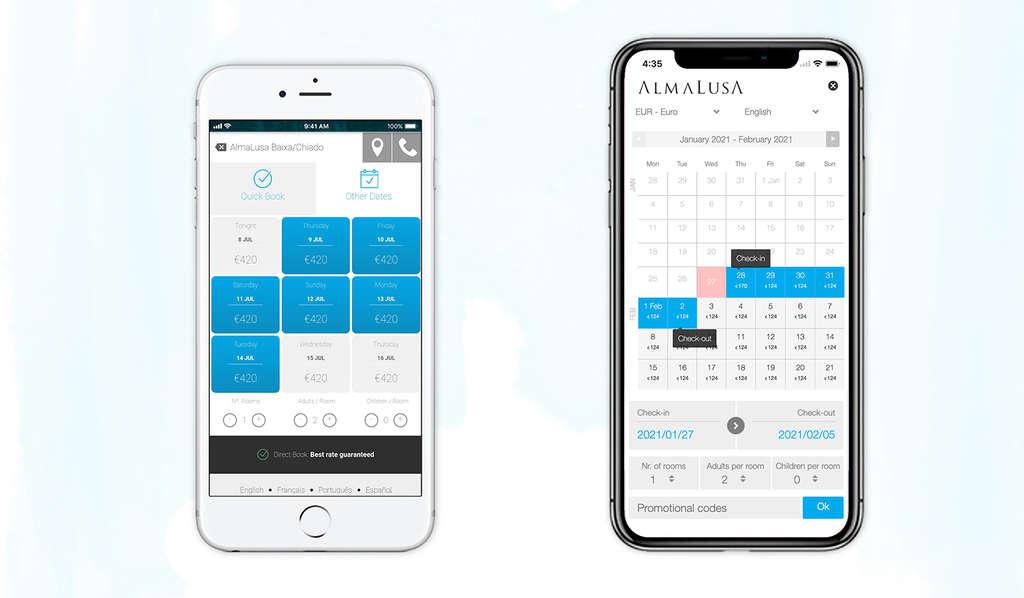
Hospitality Net applied A/B testing to optimize mobile navigation and content accessibility. The test focused on menu placement and content hierarchy to determine how users preferred to explore information.
The variation simplified navigation and prioritized frequently accessed sections, resulting in smoother user journeys and increased engagement. This experiment showed how thoughtful testing can improve mobile usability without extensive redesigns.
Mobile A/B testing examples like this emphasize the importance of understanding user context and behavior on smaller screens.
Common A/B Testing Mistakes to Avoid
A/B testing is a powerful decision-making tool, but its effectiveness depends heavily on how tests are planned, executed, and evaluated. Many teams fail to see meaningful results not because A/B testing does not work, but because avoidable mistakes undermine the accuracy of their experiments. Understanding and addressing these common pitfalls helps ensure that testing efforts lead to reliable insights and long-term improvements.
Premature Decisions
One of the most frequent mistakes in A/B testing is ending experiments too early. Teams often feel tempted to stop a test as soon as one variation appears to outperform another, especially when early results look promising. However, early trends can be misleading and may not reflect stable user behavior.
Premature decisions usually occur when tests are evaluated before reaching a sufficient sample size or before accounting for natural fluctuations in traffic. User behavior can vary significantly by time of day, day of the week, or external factors such as promotions and seasonal trends. Ending a test before capturing these variations increases the risk of false positives or false negatives.
Another issue with premature decisions is confirmation bias. Teams may unconsciously favor results that align with their expectations and stop tests once they see the outcome they hoped for. This undermines the objectivity of experimentation and leads to unreliable conclusions.
To avoid this mistake, teams should define stopping criteria before launching a test. This includes setting minimum sample sizes, test durations, and confidence thresholds. Allowing tests to run their full course ensures that results are statistically reliable and representative of real user behavior.
Unfocused Metric Selection
Choosing the wrong metrics is another common A/B testing mistake. When teams track too many metrics or select metrics that are not directly tied to business goals, test results become confusing and difficult to interpret.
An unfocused approach often leads to situations where one variation performs better on one metric but worse on another, making it unclear which version is truly more effective. For example, a change may increase click-through rates but reduce conversions or overall revenue. Without a clearly defined primary metric, teams may struggle to decide which outcome matters most.
Metrics that are too broad or loosely related to the test objective can also distort results. Vanity metrics such as page views or impressions may look impressive but fail to reflect meaningful user actions or business impact.
To prevent this issue, each A/B test should have a single primary metric that directly aligns with the test hypothesis and business objective. Secondary metrics can provide additional context, but they should support—not replace—the primary measure of success. Clear metric selection keeps analysis focused and decisions consistent.
Insufficient Retesting
Many teams treat A/B testing as a one-time activity rather than an ongoing process. Implementing a winning variation and moving on without further testing is a missed opportunity for continuous improvement.
Insufficient retesting can limit long-term gains. User behavior evolves, market conditions change, and what works today may not work tomorrow. Additionally, a successful test result often raises new questions that deserve further exploration. Without follow-up tests, teams fail to build on previous learnings.
Another risk of insufficient retesting is overgeneralization. A result that works well for one audience segment, device type, or traffic source may not perform the same way across others. Without additional tests, teams may apply changes too broadly and miss opportunities for personalization or segmentation.
Avoiding this mistake requires adopting a mindset of continuous experimentation. Teams should view each test as part of a larger optimization roadmap. Retesting successful changes, testing variations of winning elements, and validating results across different segments help organizations extract maximum value from A/B testing over time.
Turn Insights into Action with A/B Testing and Corexta
A/B testing helps you stay ahead by turning real user behavior into measurable improvements. Every successful experiment brings you closer to understanding your audience, allowing you to refine experiences based on what actually performs best. Over time, these incremental insights compound into smarter decisions and stronger results.
Corexta streamlines the A/B testing workflow with comprehensive dashboards and ready-to-use templates that make it easier to track performance and visualize outcomes. By reducing manual effort and complexity, teams can focus their energy on strategy, analysis, and optimization rather than busywork.
With features like Corexta Chat, collaboration and communication happen in one centralized workspace, helping teams move faster and stay aligned.
Create a free Corexta account today and use powerful, easy-to-use tools to improve experimentation and drive better business outcomes.
Read More: A 2026 Guide to Gantt Chart Milestones